Build an xG League Table from Understat Data
Part 1 of 6 in Soccer Analytics with StatsBomb & xG · course bundle (code + data)
What you'll build
A league table re-ranked by expected goals instead of actual results.
Goals lie. A team can score from a wild deflection or get robbed by a great save, and the scoreline won't tell you which team actually played better. Expected goals - xG - is the stat that cuts through the noise. So pull a full Premier League season from Understat, roll it up into a league table ranked by xG, and then comes the fun part: set each team's xG against the goals they really scored. That gap is what exposes who finished clinically and who left points on the pitch.
Before that, a quick definition. xG measures the quality of the chances a team created. Every shot is assigned a probability of becoming a goal based on where it was taken, how, and in what situation - a tap-in might be 0.8 xG, a speculative 30-yard effort 0.03. Add up all of a team's shots and you get the number of goals an average team "should" have scored from those chances. Compare that to reality and you've measured finishing.
This builds on your first StatsBomb pull - same idea of loading real event-derived data, different source. Let's get the data the right way, because most guides online get this part wrong.
-
Get the data the modern way (a POST request)
Here's the thing almost every older tutorial gets wrong. For years the trick to scraping Understat was to download the page HTML and yank a JSON variable out of a
<script>tag with a regular expression. That no longer works - Understat changed how its pages load. If you've been following a guide that doesre.searchon the page source, that's why it's failing.The site now serves this data from a dedicated POST endpoint, the very same one the page itself calls in the background. We just ask it directly, exactly the way the browser does: a POST to
getPlayersStatswith the league and season as form data, plus theX-Requested-Withheader that marks it as a background request.python import json import pandas as pd import requests LEAGUE, SEASON = "EPL", "2023" # Understat's 2023 = the 2023/24 season session = requests.Session() session.headers.update({ "User-Agent": "Mozilla/5.0", "Referer": "https://understat.com/", "X-Requested-With": "XMLHttpRequest", }) resp = session.post("https://understat.com/main/getPlayersStats/", data={"league": LEAGUE, "season": SEASON}, timeout=30) resp.raise_for_status() players = resp.json()["players"]One subtlety worth knowing: Understat labels seasons by their starting year, so
"2023"means the 2023/24 campaign. The response is clean JSON, and["players"]pulls out the list of player-season records. No HTML parsing, no fragile regex - just an API call. -
Load it and fix the data types
Drop the records into a DataFrame and you'll hit the classic web-data gotcha: the numbers arrive as strings. JSON from a web endpoint loves to send
"27"instead of27, and if you try to sum strings you'll get nonsense (or an error). So we cast the columns we care about - goals and the two xG flavors - to real numbers withpd.to_numeric.python df = pd.DataFrame(players) for col in ["goals", "xG", "npxG"]: df[col] = pd.to_numeric(df[col]) print(f"{len(df)} players pulled. Top xG individuals:") top = df.sort_values("xG", ascending=False).head(5) print(top[["player_name", "team_title", "goals", "xG"]])The top xG players in the league570 players pulled. Top xG individuals: player_name team_title goals xG 0 Erling Haaland Manchester City 27 31.653997 2 Alexander Isak Newcastle United 21 22.074266 6 Mohamed Salah Liverpool 18 21.941274 3 Dominic Solanke Bournemouth 19 21.406831 12 Nicolas Jackson Chelsea 14 19.860594That's a great sanity check. Erling Haaland tops the chart with 31.7 xG, and he scored 27 - the league's most dangerous chance-getter, as you'd expect. Notice Mohamed Salah at 21.9 xG but only 18 goals: a first hint that Liverpool's finishing didn't keep pace with their chances. Hold that thought.
-
Keep only single-club players
There's a data-quality wrinkle to handle before we total up teams. A handful of players transferred mid-season, and Understat stores their season under a combined label like
"ClubA,ClubB"- their goals and xG lumped across both clubs with no clean way to split them apart. If we left those rows in, we'd get phantom 21st and 22nd "teams" in our table.Because it's only a few players, the cleanest fix is to keep players who stayed at one club all season. We spot the combined labels by the comma and filter them out.
python single_club = df[~df["team_title"].str.contains(",")].copy() single_club = single_club.rename(columns={"team_title": "team"})The
~means "not," so this keeps every row whose team name does not contain a comma. Yes, we lose a sliver of league xG this way - the goals those transferred players scored - but in exchange we get an honest, clean 20-team table. That's a trade worth making, and the kind of judgment call real data work is full of. We'll note the caveat right on the chart. -
Roll players up into teams
Now the satisfying part. We
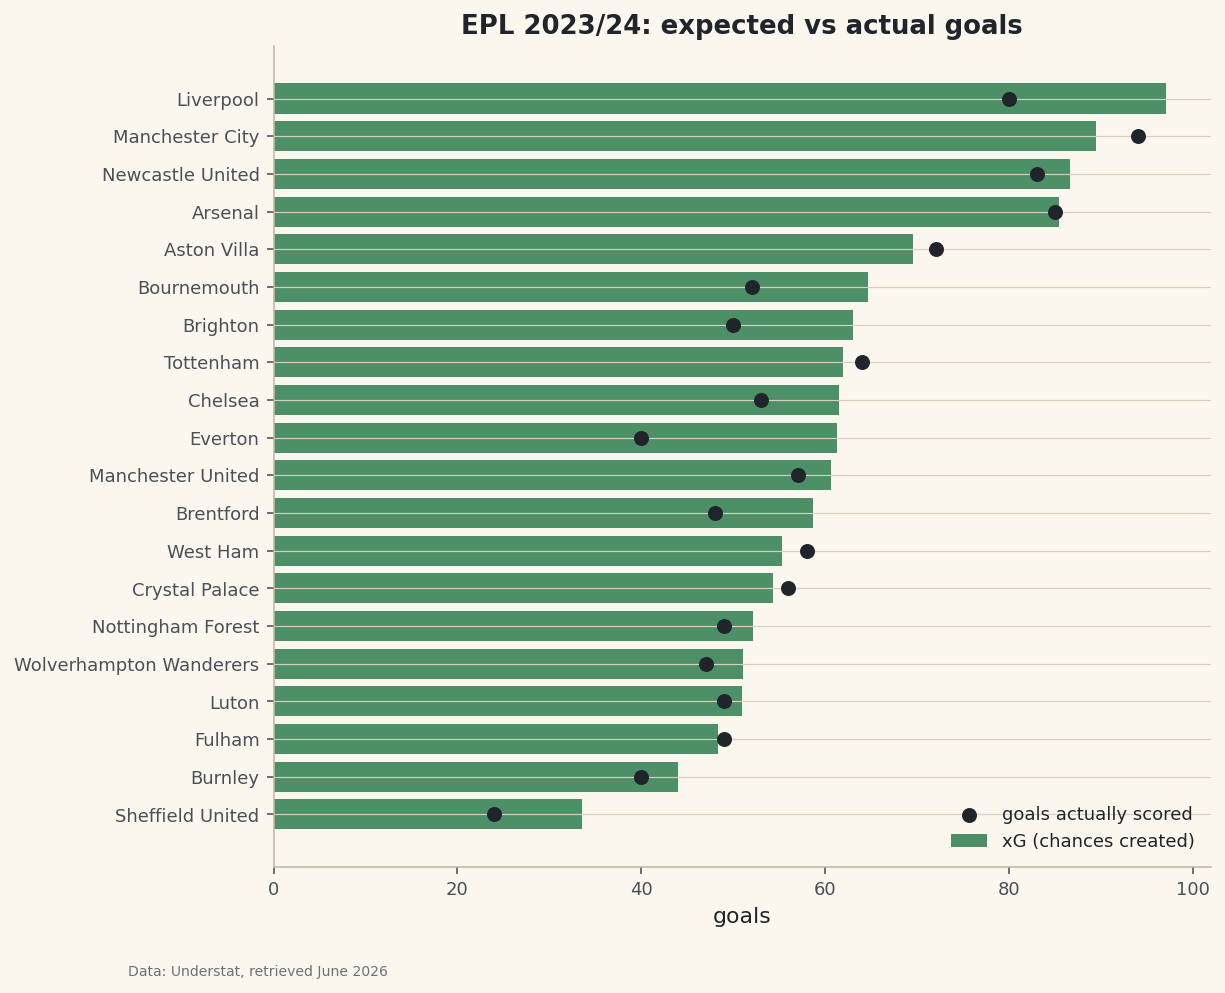
groupby("team")to gather every player onto their club, thensumtheir goals and xG into team totals. The extraDiffcolumn - actual goals minus expected - is the whole story in one number: positive means a team scored more than their chances deserved (clinical finishing), negative means they wasted chances.python table = (single_club.groupby("team") .agg(Goals=("goals", "sum"), xG=("xG", "sum")) .round(1)) table["Diff"] = (table["Goals"] - table["xG"]).round(1) # + = clinical finishing table = table.sort_values("xG", ascending=False) out = table.reset_index() out.index = range(1, len(out) + 1) print(out.to_string())The xG league table, 2023/24team Goals xG Diff 1 Liverpool 80 97.1 -17.1 2 Manchester City 94 89.4 4.6 3 Newcastle United 83 86.6 -3.6 4 Arsenal 85 85.4 -0.4 5 Aston Villa 72 69.5 2.5 6 Bournemouth 52 64.7 -12.7 7 Brighton 50 63.0 -13.0 8 Tottenham 64 61.9 2.1 9 Chelsea 53 61.5 -8.5 10 Everton 40 61.3 -21.3 11 Manchester United 57 60.6 -3.6 12 Brentford 48 58.7 -10.7 13 West Ham 58 55.3 2.7 14 Crystal Palace 56 54.3 1.7 15 Nottingham Forest 49 52.2 -3.2 16 Wolverhampton Wanderers 47 51.1 -4.1 17 Luton 49 50.9 -1.9 18 Fulham 49 48.3 0.7 19 Burnley 40 44.0 -4.0 20 Sheffield United 24 33.6 -9.6
Read down the
Diffcolumn and the season comes alive. Liverpool created the most chances in the league - 97.1 xG, more than anyone - but scored only 80, a brutal −17.1. They badly underperformed what they generated. Meanwhile Manchester City created less (89.4 xG) yet scored 94, a +4.6 - finishing their chances with ruthless efficiency. That gap is the difference between dominating the ball and dominating the scoreboard. -
Chart expected against actual
A table makes you do the subtraction in your head. A chart makes the gap jump off the page. We'll draw each team's xG as a horizontal bar and overlay a dot for the goals they actually scored. When the dot sits to the right of the bar's end, the team overperformed; to the left, they underperformed. We sort ascending so the biggest xG sits at the top.
python import matplotlib.pyplot as plt plot_df = table.sort_values("xG") fig, ax = plt.subplots(figsize=(8.4, 7.4)) ax.barh(plot_df.index, plot_df["xG"], color="#3A7D44", alpha=0.85, label="xG (chances created)") ax.scatter(plot_df["Goals"], plot_df.index, color="#20242B", zorder=5, s=42, label="goals actually scored") ax.set_title("EPL 2023/24: expected vs actual goals") ax.set_xlabel("goals") ax.legend(loc="lower right", fontsize=9, frameon=False) fig.savefig("xg_table.png", dpi=144, bbox_inches="tight")Data: Understat, retrieved June 2026 Find Liverpool at the top: the longest bar in the league, but its goals-dot sits well to the left - all that chance creation, not enough end product. Then find Manchester City just below, dot sitting to the right of its bar. The picture explains a whole season in one glance, and it's why xG has become the analyst's favorite lens on football.
Troubleshooting
My old code that scrapes a variable from the HTML returns nothing
That approach is dead - Understat no longer embeds the data as an inline JSON variable, so the regex finds nothing. Use the POST endpoint shown in step 1 instead. If a tutorial tells you to re.search the page source for playersData, it's out of date.
A 403 Forbidden or empty response from the POST
The server expects the request to look like it came from the site. Make sure you send both the Referer: https://understat.com/ header and X-Requested-With: XMLHttpRequest, plus a normal User-Agent. Missing any of these is the usual cause.
TypeError when summing, or wildly wrong totals
You forgot to cast the columns. Straight from JSON, goals and xG are strings, so summing them concatenates text instead of adding numbers. Run pd.to_numeric on every numeric column before you group, exactly as in step 2.
Challenge yourself
Swap xG for npxG - non-penalty xG - and rebuild the table. Penalties are near-automatic goals that inflate a team's expected total, so stripping them out gives a cleaner read on open-play chance creation. Does anyone's ranking move? Then go bolder: change LEAGUE to "La_liga" or "Bundesliga" and rerun the whole pipeline - the endpoint speaks every league Understat covers, so your table travels for free.
Download the script
The full script, ready to run - the same file that generated every figure on this page.
Download the finished script (13_build_an_xg_league_table_from_understat.py)This script imports a small shared helper (and reads any bundled sample data) that live next to it in /downloads/ — grab these into the same folder so it runs as-is: sdt_common.py. Or skip the collecting: the Soccer Analytics with StatsBomb & xG bundle has this whole course’s scripts and data in one ZIP.