Hockey
Beginner
Pull Your First NHL Data from the Public NHL API
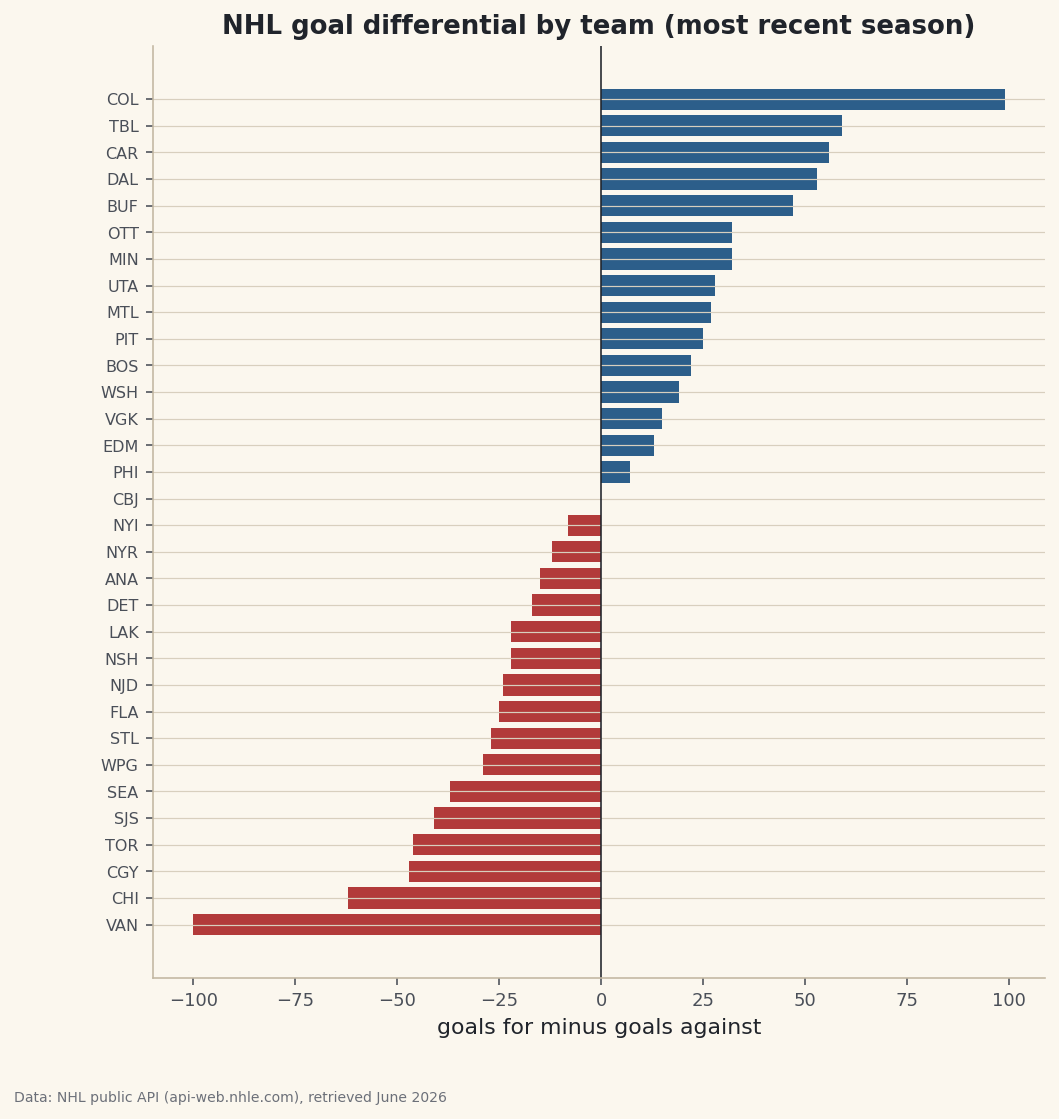
The NHL's public API needs no key. Pull live standings with a polite session, shape the JSON into a DataFrame, and chart goal differential by team.
The NHL's public API needs no key. Pull standings and play-by-play, then plot shots on a rink you draw yourself.
Start with the NHL public-API pull — it needs no key — then the shot-location tutorial, which teaches you to draw the rink every shot plot needs. The rolling goal-differential build shows you how to read team form as a time series, and the scoring-leaders chart closes the loop from raw pull to publishable figure. Together the four cover the whole working rhythm — pull, plot, trend, rank — and each runs offline on its bundled sample data if the live API is down. It's the site's shortest track by design: master these four and the basketball track's shot-chart and rating methods transfer to hockey almost line for line.
No tutorials match that filter.
The NHL's public API needs no key. Pull live standings with a polite session, shape the JSON into a DataFrame, and chart goal differential by team.
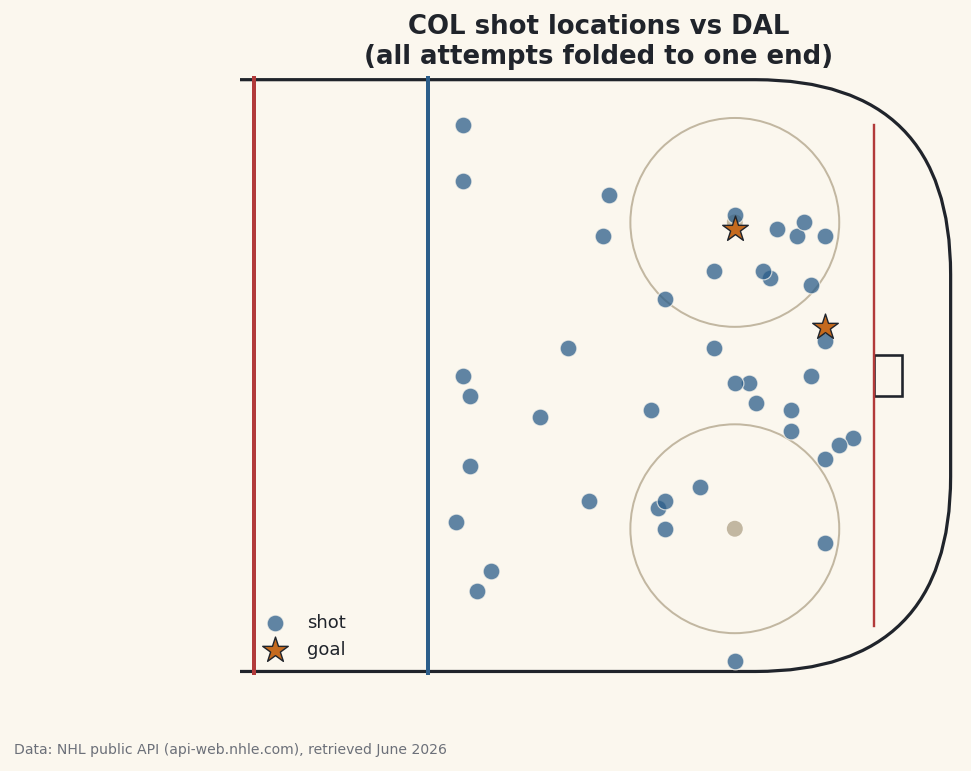
Pull a game's play-by-play from the NHL API, draw a rink in matplotlib, and plot one team's shot attempts in rink coordinates to see where they attack from.
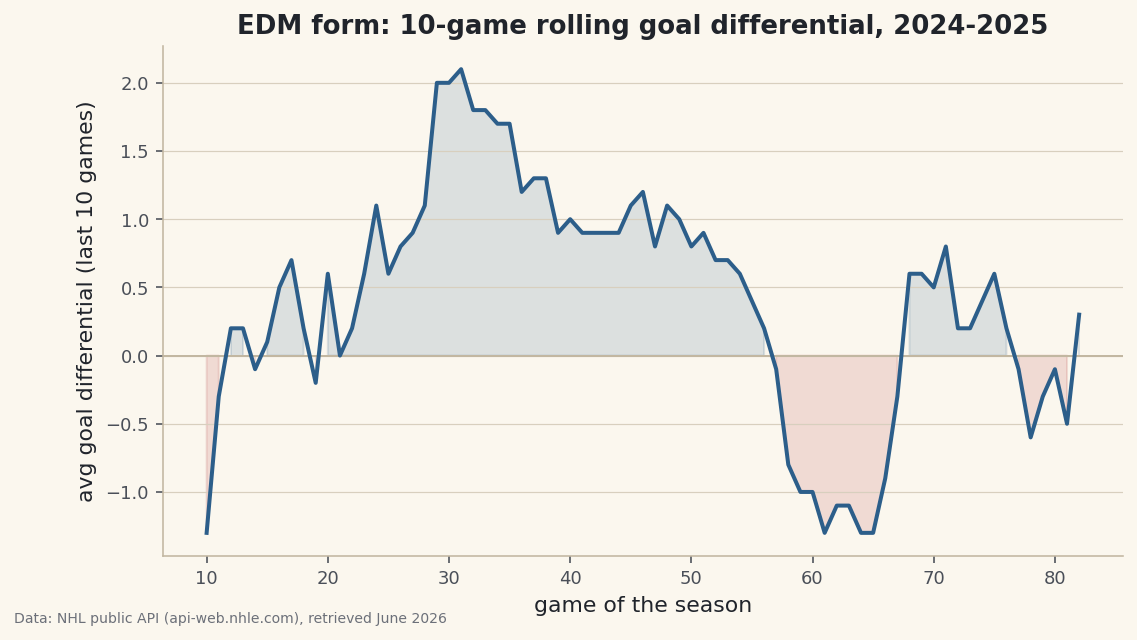
Pull a team's full NHL schedule with scores, compute a rolling goal differential, and chart a season's peaks and slumps straight from the real data.
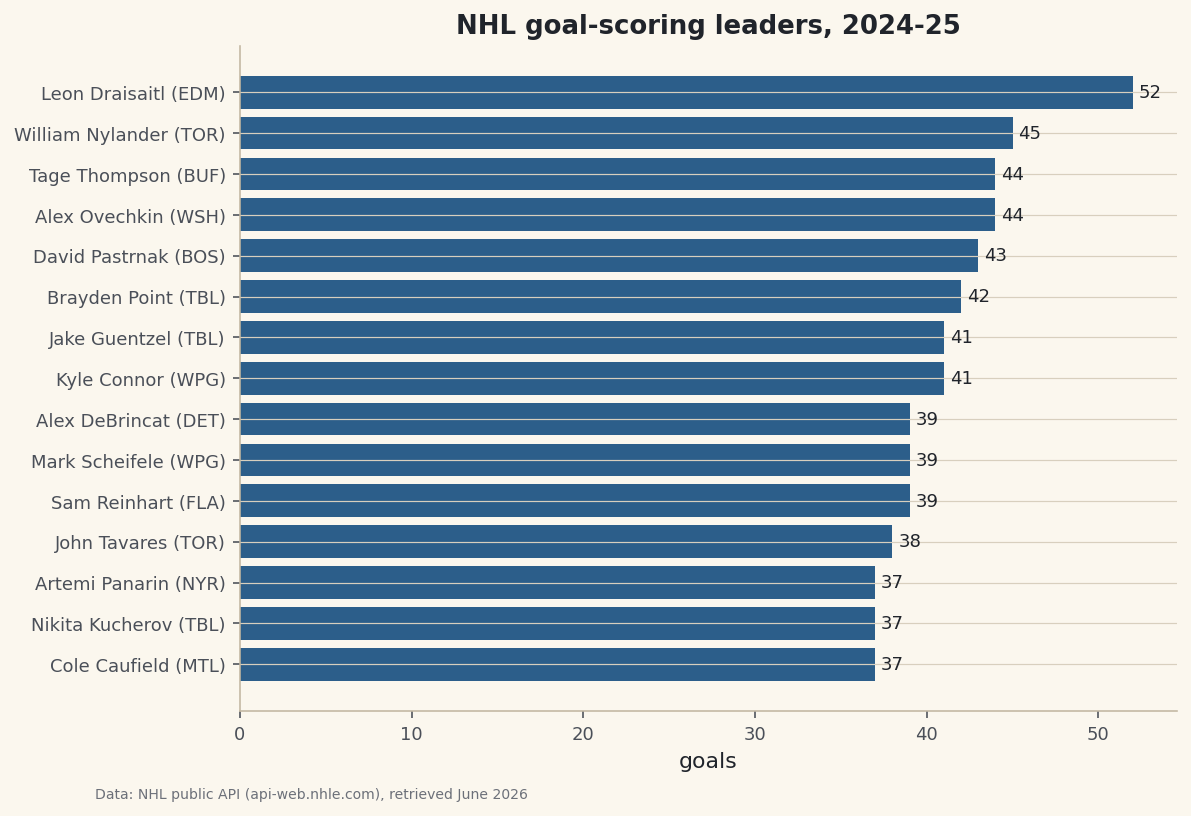
Use the NHL's stats-leaders endpoint to pull the top goal scorers, shape the nested JSON into a tidy table, and build a leaderboard chart with each player's team.