Build an NHL Goal-Scoring Leaders Chart
Part 2 of 4 in Hockey & Cross-League Projects · course bundle (code + data)
What you'll build
A clean leaderboard of the season's top goal scorers.
"Who scored the most goals?" is one of those rare questions a single API call answers outright. The NHL's public API has a dedicated stats-leaders route that hands back the league leaders in whatever category you ask for, already sorted — no ranking on your end. I'll call it for goals, reshape its nested JSON into a tidy table, and chart a clean leaderboard of the 2024-25 season's top scorers. Watch the reshaping step closely, because the real lesson is the one you'll reuse constantly: reaching into JSON when the values you want sit one level deeper than you'd like.
This builds on pulling your first NHL data from the public API, so you already know how to open a polite session and read a JSON response - we'll lean on those habits here. The data comes from the NHL public API (api-web.nhle.com), retrieved June 2026.
-
Call the stats-leaders endpoint
We open a polite session - one that sends a real browser
User-Agent, identifies itself with aReferer, and retries automatically on flaky errors - and hit the skater-stats-leaders route. The URL encodes the season as20242025and the game type as2(regular season); the query parameters ask for the goals category and cap the list at fifteen.python import matplotlib.pyplot as plt import pandas as pd import sdt_common as sdt sdt.init("nhl-goal-scoring-leaders-chart") session = sdt.polite_session(referer="https://www.nhl.com/") payload = session.get("https://api-web.nhle.com/v1/skater-stats-leaders/20242025/2", params={"categories": "goals", "limit": 15}, timeout=30).json()Two pieces of the URL grammar are worth memorizing. The season is written as the two calendar years glued together -
20242025for the 2024-25 season - which is the NHL's convention everywhere. The trailing/2is the game-type code:2is the regular season,3is the playoffs. Change those two tokens and you can pull leaders for any season or the postseason without touching anything else. Passingparams=rather than hand-building the query string letsrequestshandle the URL encoding for us. -
Understand the nested shape
Here's the part that trips up newcomers to JSON. The response isn't a flat list of
{"name": "...", "goals": 52}records. The leaders live under a key named after the category -payload["goals"]- and inside each player, the fields you want are themselves wrapped in little objects. A player's first name doesn't arrive as the string"Leon"; it arrives as{"default": "Leon"}, keyed by language, because the NHL serves names in multiple languages. The goal count is even sneakier: it lives under the generic key"value", not"goals", because this same endpoint shape is reused for every category.python # Each player looks roughly like: # {"firstName": {"default": "Leon"}, "lastName": {"default": "Draisaitl"}, # "teamAbbrev": {"default": "EDM"}, "value": 52, ...} # so names hide behind ["default"], and the stat is always ["value"].That single idea - reach into
["default"]for the text, read["value"]for the number - is the entire trick to shaping this data. Once you've seen it, the rest is bookkeeping. If you've parsed the NHL standings before, this is the same["default"]language-object pattern you met there, just on a different endpoint. -
Flatten the JSON into a DataFrame
Now we walk the list of players and build one flat dictionary each, unwrapping the language objects as we go. The team abbreviation needs a little defensive handling - occasionally it can arrive as a bare string rather than a language object - so we route it through a tiny helper that copes with both.
python def abbrev(team): return team["default"] if isinstance(team, dict) else team rows = [{ "player": f"{p['firstName']['default']} {p['lastName']['default']}", "team": abbrev(p.get("teamAbbrev", "")), "goals": p["value"], } for p in payload["goals"]] df = pd.DataFrame(rows)This is a list comprehension building a list of dictionaries - for each player
p, make one flat record - and wrapping it inpd.DataFrame(...)turns that list into a proper table. We stitch the full name from the two language objects with an f-string, pull the goal count from["value"], and lean onabbrevfor the team. Theisinstance(team, dict)check inside that helper is a small bit of insurance: it asks "is this a language object or already a plain string?" and handles each case, so one oddly-shaped record can't crash the whole parse. -
Read the leaderboard
Let's print the table with a 1-based rank so it reads like a real leaderboard rather than a zero-indexed DataFrame.
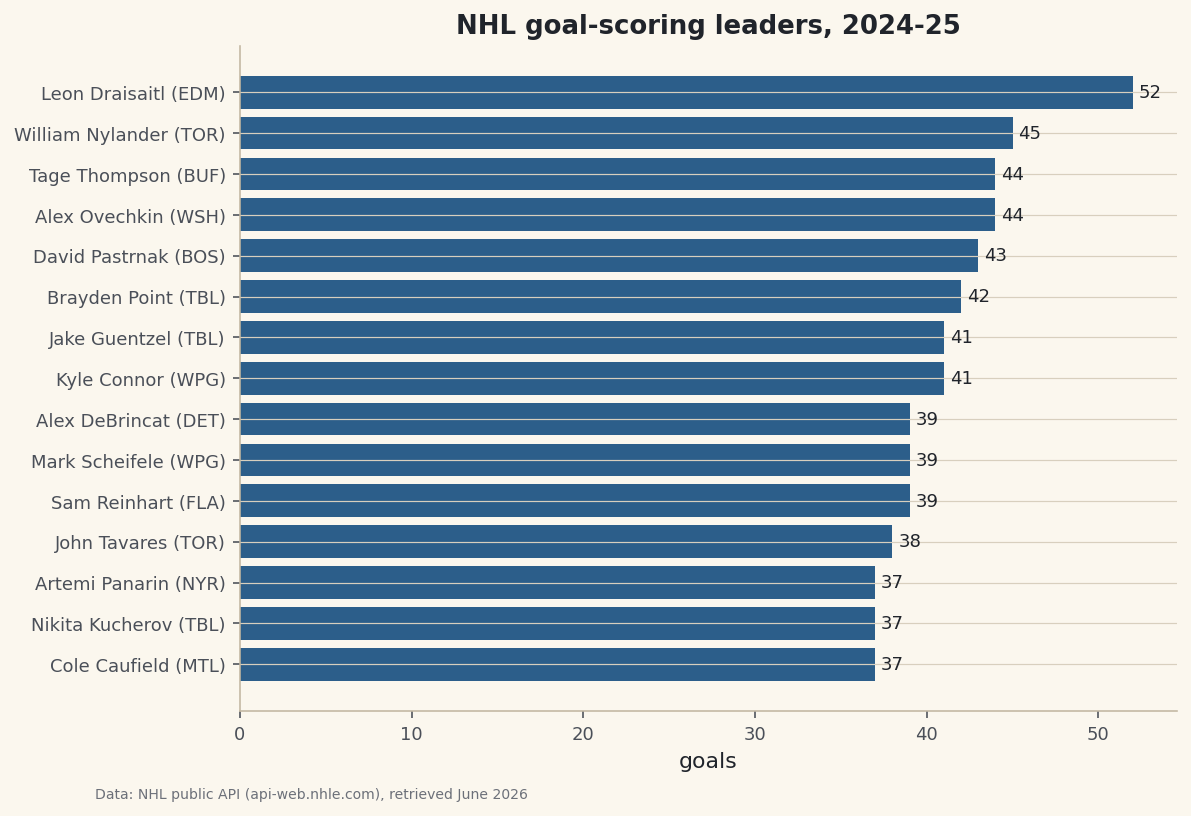
python with sdt.snippet("leaders"): out = df.copy() out.index = range(1, len(out) + 1) print("NHL goal-scoring leaders, 2024-25:") print(out.to_string())The 2024-25 goal-scoring leadersNHL goal-scoring leaders, 2024-25: player team goals 1 Leon Draisaitl EDM 52 2 William Nylander TOR 45 3 Alex Ovechkin WSH 44 4 Tage Thompson BUF 44 5 David Pastrnak BOS 43 6 Brayden Point TBL 42 7 Kyle Connor WPG 41 8 Jake Guentzel TBL 41 9 Mark Scheifele WPG 39 10 Sam Reinhart FLA 39 11 Alex DeBrincat DET 39 12 John Tavares TOR 38 13 Nikita Kucherov TBL 37 14 Artemi Panarin NYR 37 15 Cole Caufield MTL 37These are exactly the names you'd hope to see, which is the sign the parsing worked. Leon Draisaitl of Edmonton led the league with 52 goals - the only player to clear 50 - and the gap back to second is telling: William Nylander of Toronto sits at 45, then Alex Ovechkin and Tage Thompson tie at 44, with David Pastrnak right behind at 43. The fact that the king of goal-scoring himself, Ovechkin, is up near the top but not at it is a good reality check on the data. Reassigning the index to
range(1, len(out) + 1)is a one-line way to renumber the rows 1, 2, 3 instead of 0, 1, 2 - a small touch that turns a raw table into something that reads as a ranking. These are real 2024-25 totals, retrieved June 2026. -
Chart it as a leaderboard
A horizontal bar chart is a leaderboard - longest bar on top. We sort ascending so matplotlib stacks the top scorer at the top, label each bar with its goal total, and combine the player's name and team into one tidy y-axis label.
python plot_df = df.sort_values("goals") fig, ax = plt.subplots(figsize=(8.4, 6)) bars = ax.barh(plot_df["player"] + " (" + plot_df["team"] + ")", plot_df["goals"], color=sdt.sport_color("hockey")) ax.bar_label(bars, fmt="%d", padding=3, fontsize=9) ax.set_xlabel("goals") ax.set_title("NHL goal-scoring leaders, 2024-25") sdt.save_fig(fig, "goal_leaders", source="NHL public API (api-web.nhle.com)")Data: NHL public API (api-web.nhle.com), retrieved June 2026 The reason we sort ascending before plotting is a quirk worth internalizing:
barhdraws from the bottom up, so the largest value plotted last ends up on top. Building the y-axis label by string-concatenating the columns -player + " (" + team + ")"- is element-wise, so every bar gets its own "Name (TEAM)" tag in one expression. Thebar_labelcall writes the exact goal count at the end of each bar withfmt="%d"(a whole number), so a reader gets the precise figure without squinting at the axis. Andsave_figstamps the data source and retrieval date in the corner, so the chart's provenance is never lost when the image is shared on its own.
Troubleshooting
KeyError: 'default' when building the rows
A field you treated as a language object was actually a plain value (or the reverse). That's exactly why teamAbbrev goes through the abbrev helper. To see a field's real shape, print one raw player with import json; print(json.dumps(payload["goals"][0], indent=2)) and look at each key - text fields like firstName usually need ["default"], while value is a bare number.
KeyError: 'goals' from the payload
The leaders live under the key that matches the category you requested. If you asked for categories=goals, read payload["goals"]; if you asked for assists, read payload["assists"]. A mismatch between the requested category and the key you index is the usual cause. Confirm the request succeeded before parsing - the response should be a dict whose keys are the categories you asked for.
The stat column is empty or all the same number
You probably read the wrong field for the count. This endpoint always stores the leading stat under the generic key "value", not under "goals" - the name value is reused across every category. Pull p["value"] for the number, and you'll get the real totals.
The request hangs or returns an error page
We pass timeout=30 so a request can't hang forever, and the polite session retries transient 429/503 errors with backoff. If it still fails, double-check the season token (20242025) and game-type code (/2) in the URL, and confirm you're online. An off-season or a future season may simply have no leaders to return yet.
Challenge yourself
The endpoint is far more general than we've used it. Swap categories from goals to assists or points and you have an instant assists or points leaderboard with zero other changes - proof that you built a reusable shape, not a one-off. Then go one step further: call it twice, once for goals and once for assists, merge the two tables on the player's name, and compute each player's points as goals plus assists. Sort by that and you've rebuilt the league scoring race from two API calls. For a richer follow-up, take the same polite session over to build a shot-location plot for an NHL team and see where those goals are actually coming from on the ice.
Download the script
The full script, ready to run - the same file that generated every figure on this page.
Download the finished script (37_nhl_goal_scoring_leaders_chart.py)This script imports a small shared helper (and reads any bundled sample data) that live next to it in /downloads/ — grab these into the same folder so it runs as-is: sdt_common.py. Or skip the collecting: the Hockey & Cross-League Projects bundle has this whole course’s scripts and data in one ZIP.