Pull Your First NHL Data from the Public NHL API
Part 6 of 6 in Working with Real Sports APIs · course bundle (code + data)
What you'll build
A standings table pulled live from the NHL's public API, ranked and charted.
Not every sport hands you a friendly Python library to hide behind. Sometimes you talk to a raw web API and shape the JSON yourself - and honestly, that's the more valuable skill, because it works for almost any data source on the internet, not just this one. The NHL's public API is the perfect place to learn it: no key, no signup, no token, no nonsense. We'll pull the current standings over a polite HTTP session, flatten the nested JSON into a tidy DataFrame, work out each team's goal differential, and chart it as a diverging bar plot - and you'll come out the other side able to do the same dance with most APIs you meet.
This builds on how to read API documentation, so you already know how to find an endpoint and read a response. The data comes from the NHL public API (api-web.nhle.com), retrieved June 2026.
-
Open a polite session
We could call
requests.getdirectly, but we'll use a session instead, configured to behave like a well-mannered browser. A polite session sends a normalUser-Agentheader, identifies where the request is coming from with aReferer, and automatically retries with backoff if the server returns a temporary error like 429 (too many requests) or 503 (service unavailable). These are the habits that keep a free public API open for everyone.python import matplotlib.pyplot as plt import pandas as pd session = sdt.polite_session(referer="https://www.nhl.com/") resp = session.get("https://api-web.nhle.com/v1/standings/now", timeout=30) resp.raise_for_status() teams = resp.json()["standings"]The endpoint
/v1/standings/nowreturns the standings as of today.raise_for_status()turns any HTTP error into a clean Python exception so a bad response fails loudly instead of silently. Andresp.json()["standings"]reaches into the response and pulls out the list of team objects - the part we actually want. -
Understand the nested shape
Here's the thing that trips up newcomers to JSON APIs: the values aren't always plain strings. The NHL serves names as little objects keyed by language, because the league is bilingual. A team's name arrives looking like
{"default": "Colorado Avalanche", "fr": "Avalanche du Colorado"}. To get the English string you have to reach one level deeper, into the"default"key. That single idea -teamName["default"]- is the crux of shaping this data.python # Each team's name and abbreviation arrive as language objects: # t["teamName"] -> {"default": "Colorado Avalanche", "fr": ...} # so we reach into ["default"] to get the plain English string.Most other fields - wins, losses, points, goals - are plain numbers and can be read directly. It's mainly the text fields that hide behind
["default"]. -
Flatten the JSON into a DataFrame
Now we walk the list of teams and build one clean dictionary per team, picking out exactly the fields we want and unwrapping the language objects as we go. Wrapping that list of dictionaries in
pd.DataFrame(...)gives us a proper table.python df = pd.DataFrame([{ "Team": t["teamName"]["default"], "Abbr": t["teamAbbrev"]["default"], "Division": t["divisionName"], "GP": t["gamesPlayed"], "W": t["wins"], "L": t["losses"], "OTL": t["otLosses"], "PTS": t["points"], "GF": t["goalFor"], "GA": t["goalAgainst"], } for t in teams])This is a list comprehension building a list of dictionaries: for each team
t, make a flat record. The two text fields use["default"]; everything else reads straight across. The result is a familiar, rectangular DataFrame - the shape every later step expects. -
Compute goal differential
Goal differential - goals scored minus goals allowed - is the single most honest one-number summary of a hockey team's season. A new column is just arithmetic on two existing ones, and then we sort so the best teams sit at the top.
python df["Diff"] = df["GF"] - df["GA"] df = df.sort_values("Diff", ascending=False).reset_index(drop=True)reset_index(drop=True)renumbers the rows 0, 1, 2, … after the sort so the index reads as a clean ranking instead of the scrambled original order. It's a small touch that makes the printed table much easier to read. -
Look at the best and worst
Let's print a slice of the table to confirm the data and the differential make sense.
python print(f"Pulled {len(df)} teams. Best and worst by goal differential:") sdt.show_df(df[["Team", "GP", "PTS", "GF", "GA", "Diff"]], n=6)Top teams by goal differentialPulled 32 teams. Best and worst by goal differential: Team GP PTS GF GA Diff 0 Colorado Avalanche 82 121 302 203 99 1 Tampa Bay Lightning 82 106 290 231 59 2 Carolina Hurricanes 82 113 296 240 56 3 Dallas Stars 82 112 279 226 53 4 Buffalo Sabres 82 109 288 241 47 5 Minnesota Wild 82 104 272 240 32Thirty-two teams, exactly the size of the league - a good sanity check that we caught everyone. At the top sits the Colorado Avalanche with a goal differential of +99: 302 goals scored against just 203 allowed over 82 games, good for 121 points. That dominance over a full season is exactly what a +99 differential looks like, and the orderly drop-off behind them - Tampa Bay at +59, Carolina at +56, Dallas at +53 - tells you the parsing worked and the sort is correct.
-
Chart it as a diverging bar plot
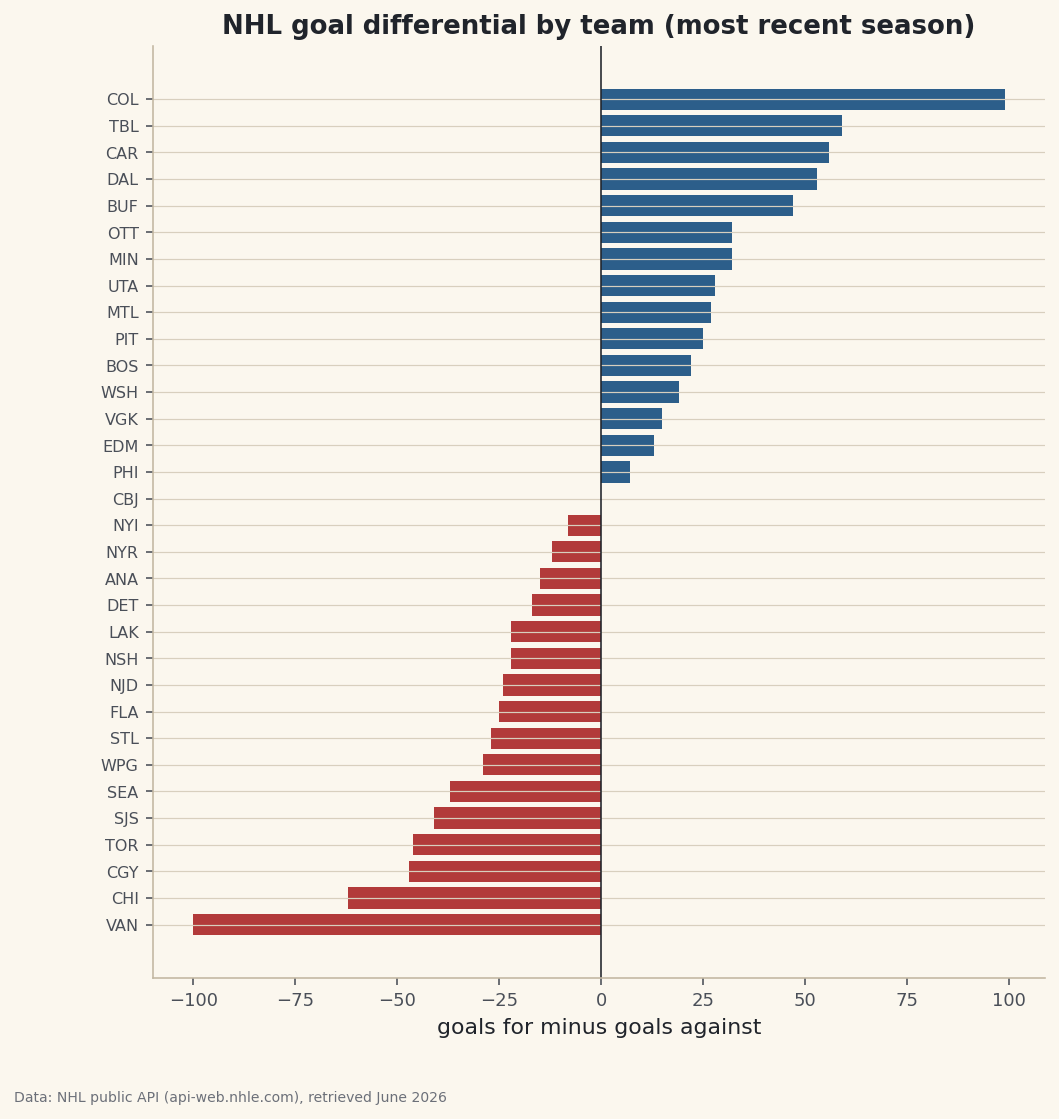
Goal differential is naturally two-sided: some teams are positive, some negative. A diverging bar chart - bars growing right from a center line for good teams, left for bad ones, colored differently on each side - is the perfect way to show that. We color positives in hockey blue and negatives in a warning red, sort ascending so matplotlib stacks the best team at the top, and draw a vertical line at zero as the dividing point.
python # A diverging bar chart: green for teams above zero, red for below. plot_df = df.sort_values("Diff") colors = [sdt.sport_color("hockey") if d >= 0 else sdt.SPORT_COLORS["baseball"] for d in plot_df["Diff"]] fig, ax = plt.subplots(figsize=(8, 8.4)) ax.barh(plot_df["Abbr"], plot_df["Diff"], color=colors) ax.axvline(0, color="#20242B", linewidth=0.8) ax.set_title("NHL goal differential by team (most recent season)") ax.set_xlabel("goals for minus goals against") ax.tick_params(axis="y", labelsize=8) fig.savefig("goal_differential.png", dpi=144, bbox_inches="tight")Data: NHL public API (api-web.nhle.com), retrieved June 2026 The color list is built with a comprehension that checks each value's sign - blue if it's zero or positive, red if negative - so the chart paints itself correctly no matter which teams end up on which side. The zero line is the visual spine of the whole plot: every bar reaching right is a team that outscored its opponents, every bar reaching left is one that got outscored. You can read the league's pecking order in a single glance.
Troubleshooting
KeyError: 'default' when building the DataFrame
A field you assumed was a language object is actually a plain value, or vice versa. Print one raw team with import json; print(json.dumps(teams[0], indent=2)) and look at each field's shape. Text fields like teamName need ["default"]; numeric fields like points do not.
KeyError: 'standings' from the JSON
The response wasn't the standings you expected - often a typo in the URL or a transient error page. Confirm the endpoint is exactly https://api-web.nhle.com/v1/standings/now, and check resp.status_code is 200 before reading resp.json().
The request hangs or times out
We pass timeout=30 so a request can't hang forever, and our polite session retries the flaky status codes automatically with backoff. If it still fails, you may be offline or rate-limited; wait a moment and run it again rather than firing repeated requests by hand.
Every team shows 0 games played
You're likely hitting the API in the dead of the offseason, before a new season's games count. Try the /v1/standings/now endpoint during the season, or look at last season's final standings - the parsing code is identical either way.
Challenge yourself
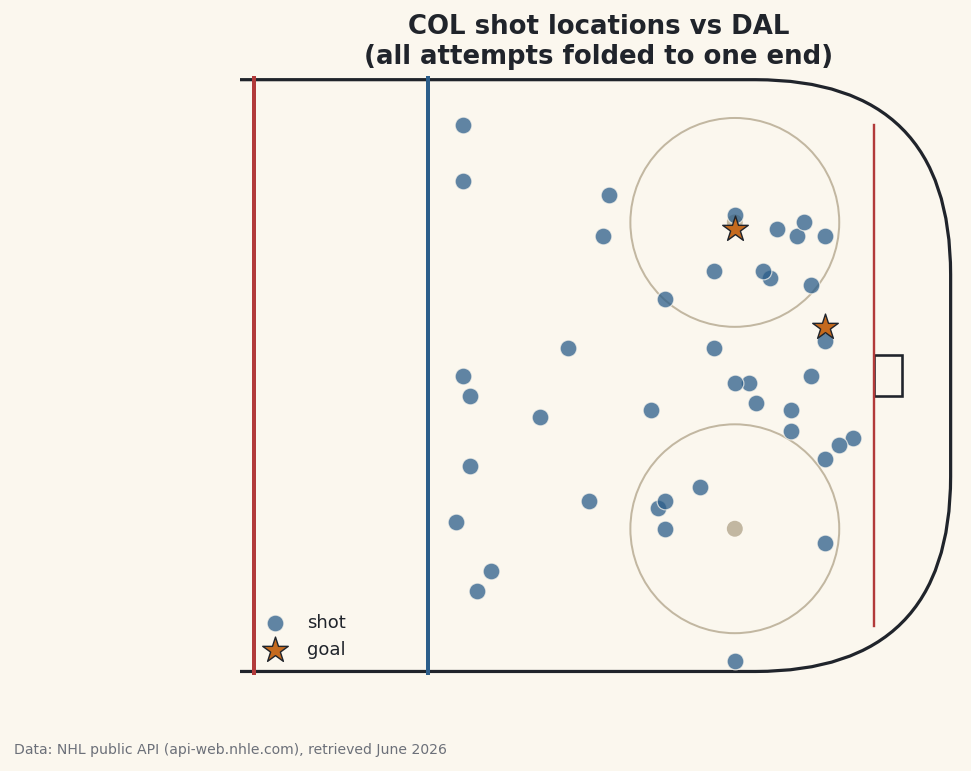
Group the DataFrame by Division and find the team with the best goal differential in each - df.loc[df.groupby("Division")["Diff"].idxmax()] is a slick one-liner once you've met groupby. Then add a points-per-game column (PTS / GP) and see whether the goal-differential order and the points order ever disagree; when they do, you've found a team that wins close games or loses blowouts. Ready for the next step? Use the same polite session to build a shot-location plot for an NHL team.
Get the code
Want it all in one file? This is the exact script that produced the outputs above.
Download the finished script (18_pull_your_first_nhl_data_from_the_public_api.py)This script imports a small shared helper (and reads any bundled sample data) that live next to it in /downloads/ — grab these into the same folder so it runs as-is: sdt_common.py. Or skip the collecting: the Working with Real Sports APIs bundle has this whole course’s scripts and data in one ZIP.