Soccer
Beginner
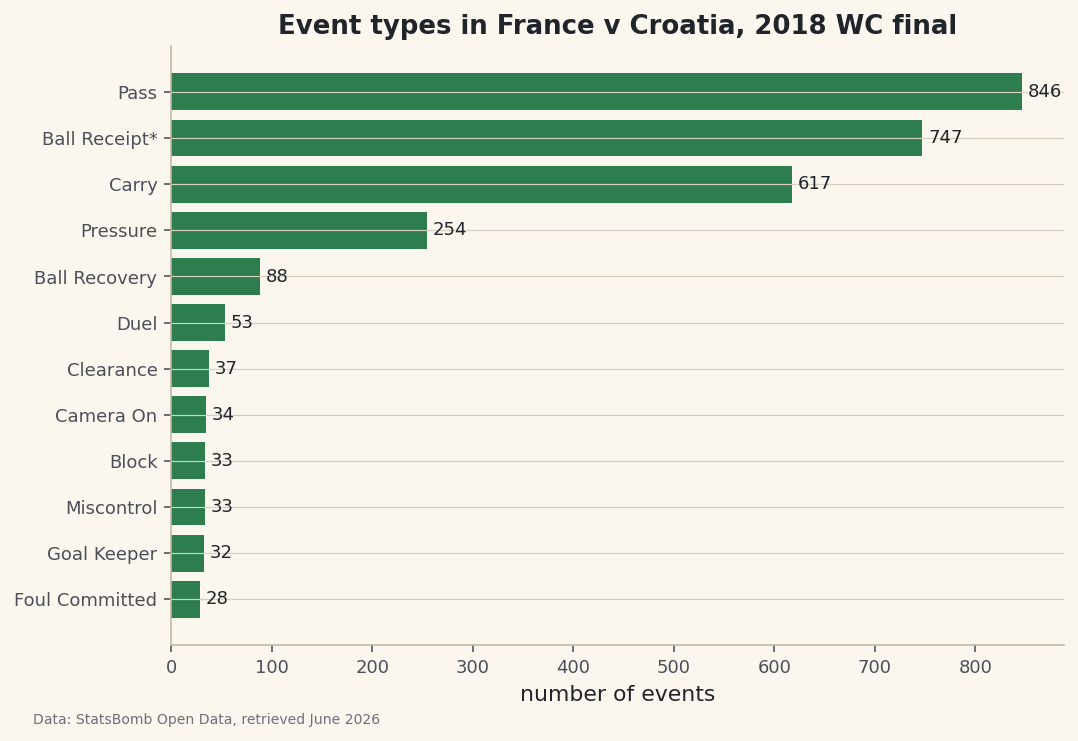
Pull Your First Match Data with StatsBomb Open Data
Use statsbombpy to load free, event-level data for a real match, understand the events table, and summarize it - with the attribution StatsBomb's license requires.
Free event data from StatsBomb plus xG from Understat let you analyse matches like a pro - no paid feed required.
The xG explainers come first — they're the language of everything else. Then the StatsBomb event-data tutorials show you how professional match data is actually structured, and the World Cup scoring tutorial applies one groupby to a live-tournament snapshot. Soccer's bundled data includes real World Cup results, so every claim is checkable from the files you downloaded.
No tutorials match that filter.
Use statsbombpy to load free, event-level data for a real match, understand the events table, and summarize it - with the attribution StatsBomb's license requires.
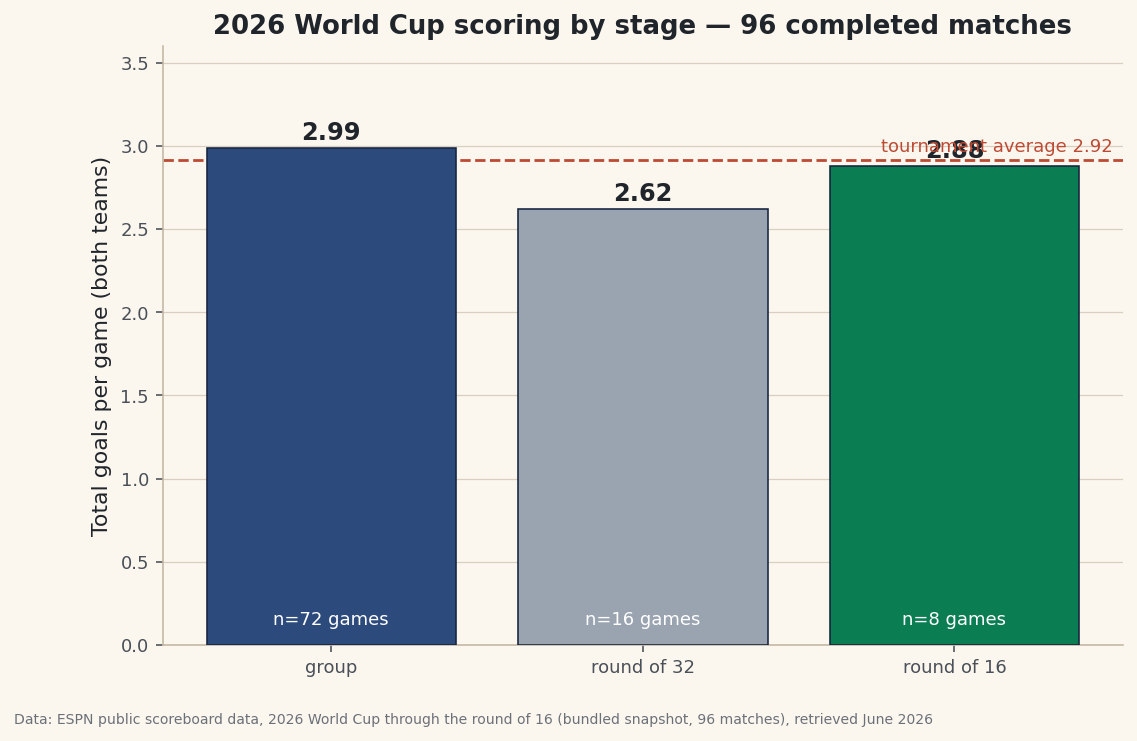
Test 'the knockouts tighten up' on a real 96-match 2026 World Cup snapshot with one pandas groupby — goals per game, both-scored and goalless rates by stage.
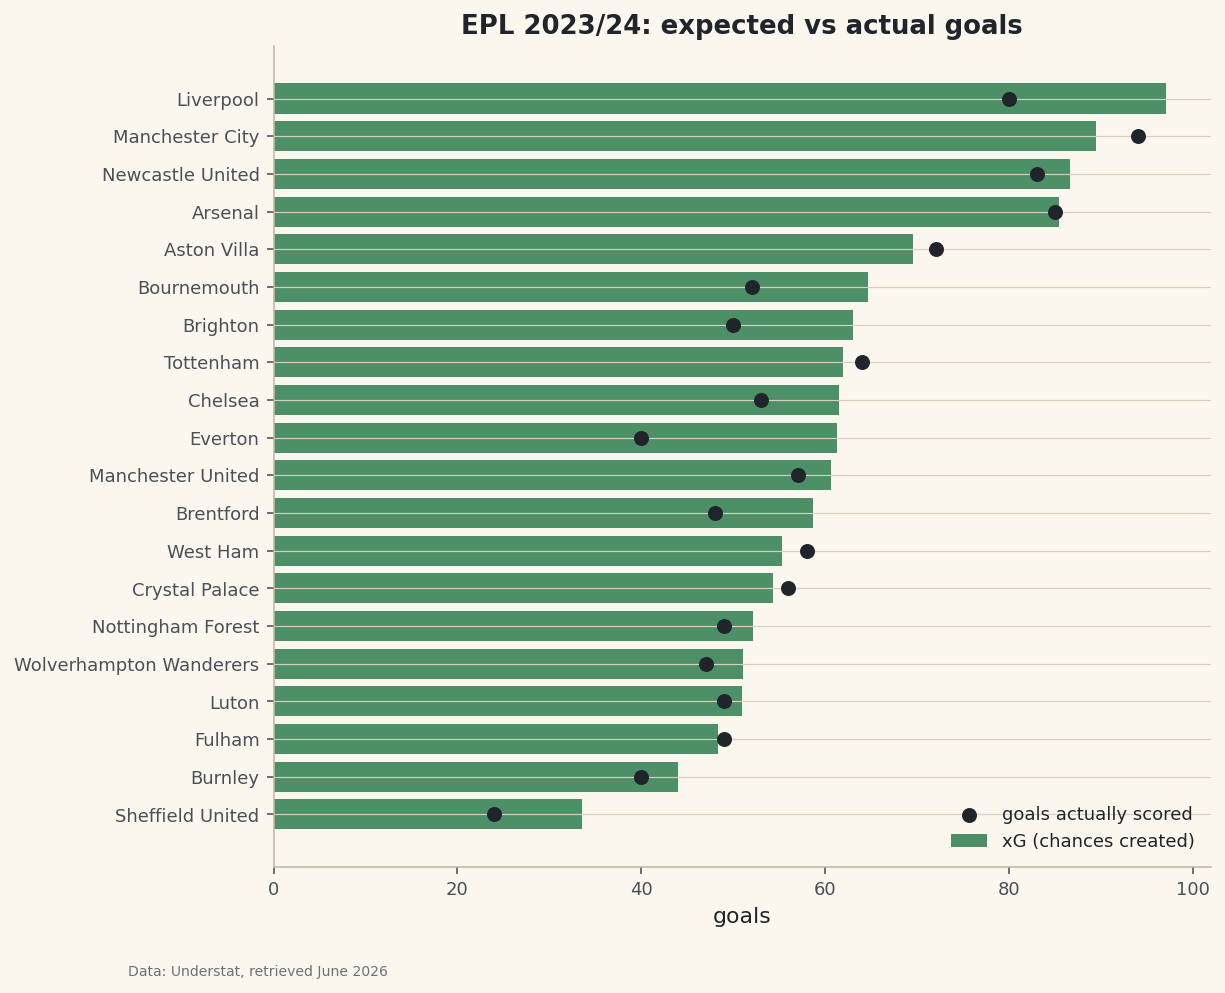
Pull a season of Understat shot-level xG via its JSON endpoint, aggregate it to a team table, and compare an xG-based table against the real one.
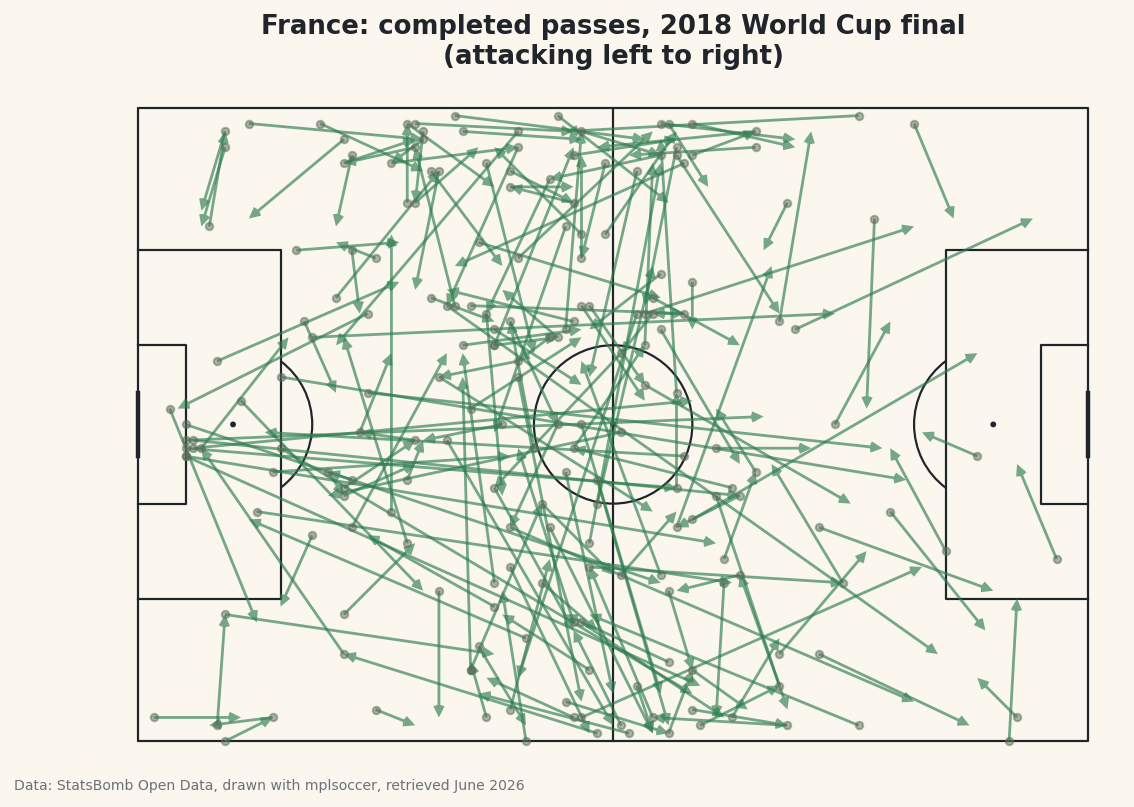
Filter a match's passes from StatsBomb event data and draw them as arrows on a correctly-proportioned pitch using mplsoccer, with StatsBomb attribution.
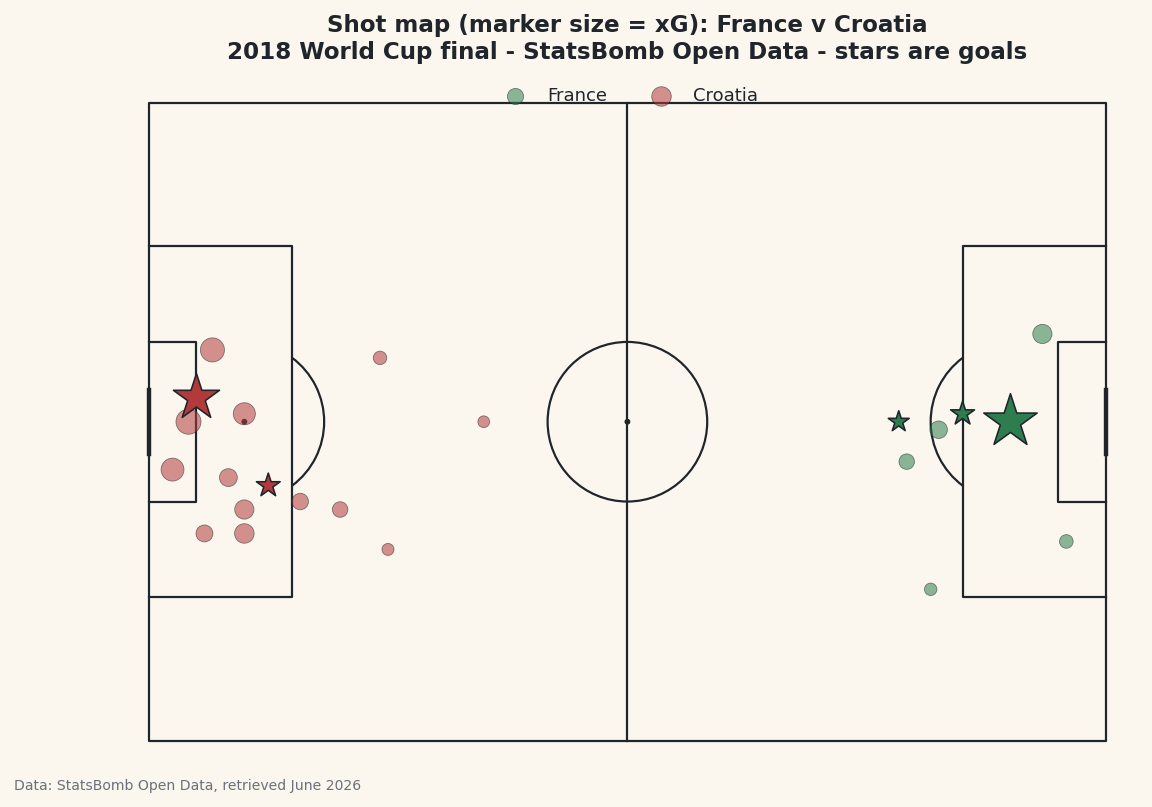
Plot every shot from a real match on an mplsoccer pitch, sized by its expected-goals value with goals highlighted — the most useful soccer viz there is.
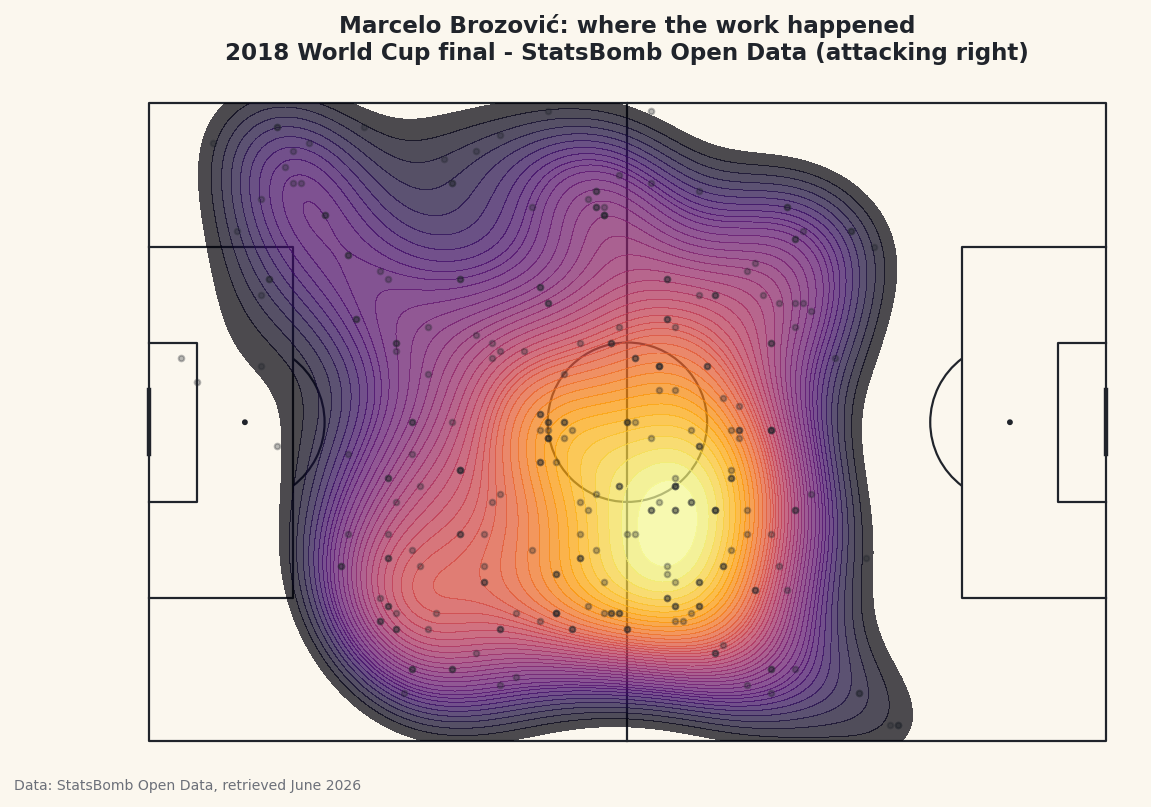
Collect every action a player took from StatsBomb event data and turn the locations into a smooth territory heatmap on the pitch, showing where they did their work.
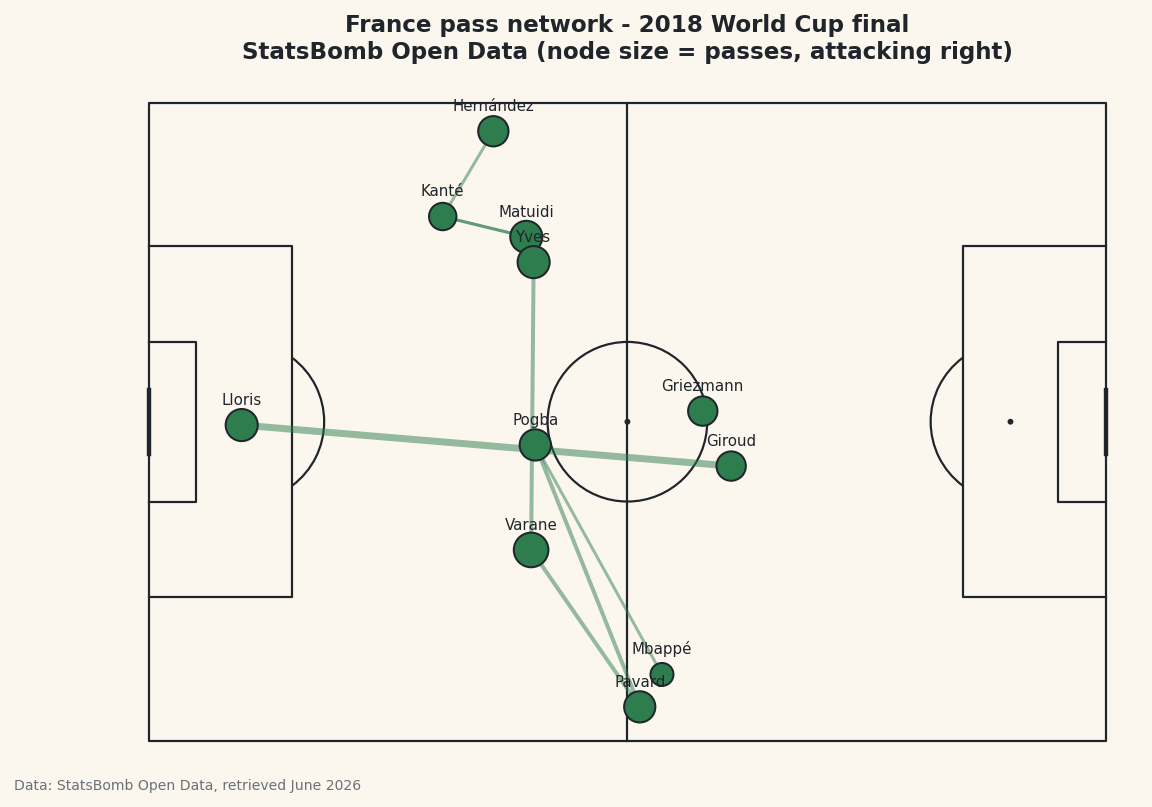
Combine players' average positions with their pass combinations to draw a pass network - the chart that reveals a team's shape and its most important connections.