Group vs Knockout Scoring at the 2026 World Cup, with groupby
Part 7 of 8 in Soccer Analytics with StatsBomb & xG · course bundle (code + data)
What you'll build
One pandas groupby over the complete 2026 World Cup - all 104 matches, group stage through the final: goals per game, both-teams-scored rate, and goalless share by stage - plus a stage chart that tests the 'knockouts tighten up' cliche on the full tournament.
Every World Cup produces the same claim by its second week: "the knockouts tighten up." It's a perfect first analytics question because it's checkable with one groupby — and because the answer, on real data, is messier and more interesting than the cliché. We'll test it on the complete record of the 2026 World Cup: all 104 matches, group stage through the final, bundled as wc2026_results.csv so everything runs offline.
This builds on Grouping, Pivoting and Reshaping — the general tool — and applies it to a single sharp question. The rhythm here (derive columns, group, aggregate, chart with sample sizes showing) is the same one behind every stage-split, season-split or home/away-split table you've ever read.
-
Load the matches and derive the columns you wish existed
The CSV has one row per match: date, stage, the two teams, and the two scores. The three columns the question needs — total goals, did both teams score, was it goalless — don't exist yet, so make them. This derive-then-aggregate rhythm is most of real analysis.
python import pandas as pd df = pd.read_csv("wc2026_results.csv") df["total_goals"] = df["home_goals"] + df["away_goals"] df["both_scored"] = (df["home_goals"] > 0) & (df["away_goals"] > 0) df["goalless"] = df["total_goals"] == 0One row per real matchdate stage home away total_goals 2026-06-11 group Mexico South Africa 2 2026-06-12 group South Korea Czechia 3 2026-06-12 group Canada Bosnia-Herzegovina 2 2026-06-13 group United States Paraguay 5 ... 104 matches, stages: group, round of 32, round of 16, quarterfinal, semifinal, third place, final
-
One groupby, five answers
Group by stage and aggregate five ways at once with named aggregations: how many games, how many goals, goals per game, the share where both teams scored, and the goalless share.
reindexputs the seven stages in tournament order instead of alphabetical — a tiny step that saves every reader of your table a double-take.python stage_order = ["group", "round of 32", "round of 16", "quarterfinal", "semifinal", "third place", "final"] by_stage = ( df.groupby("stage") .agg(games=("total_goals", "size"), goals=("total_goals", "sum"), goals_per_game=("total_goals", "mean"), both_scored=("both_scored", "mean"), goalless=("goalless", "mean")) .reindex(stage_order) )The cliché, confrontedgames goals goals_per_game both_scored goalless stage group 72 215 2.99 0.542 0.097 round of 32 16 42 2.62 0.562 0.000 round of 16 8 23 2.88 0.500 0.125 quarterfinal 4 12 3.00 0.750 0.000 semifinal 2 5 2.50 0.500 0.000 third place 1 10 10.00 1.000 0.000 final 1 1 1.00 0.000 0.000 Knockouts pooled: 32 games, 2.91 goals/game (groups: 2.99) ...and without the third-place game: 31 games, 2.68 goals/game
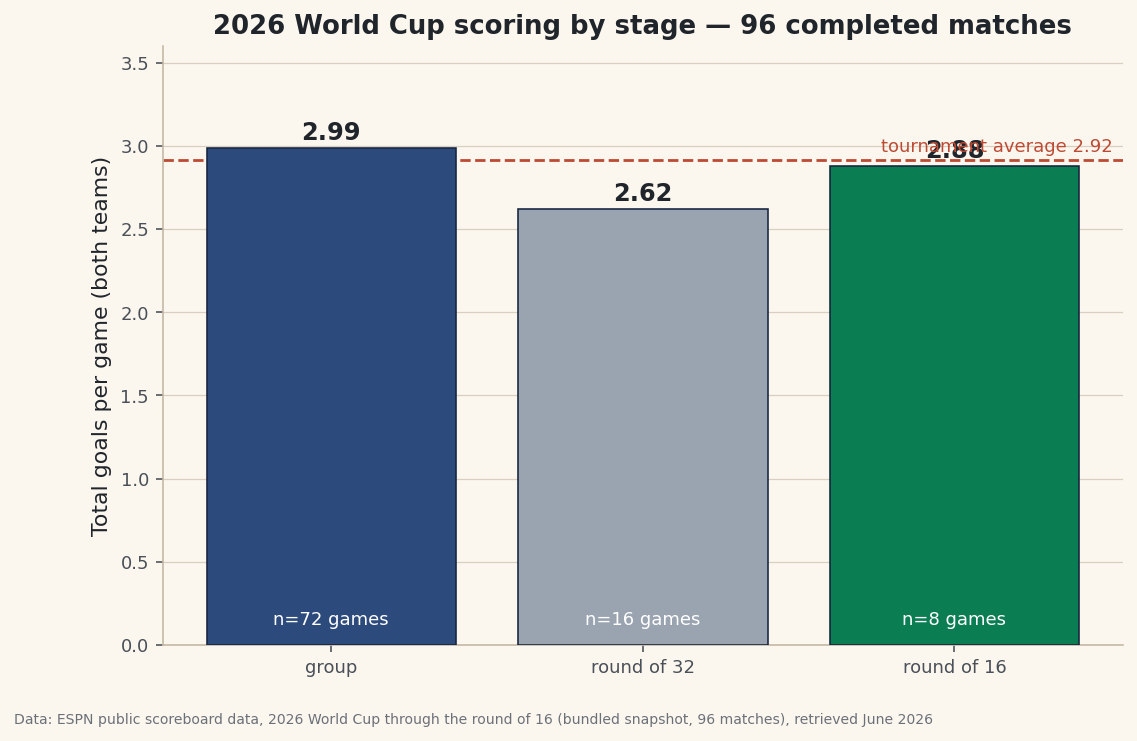
Read the goals-per-game column honestly. Scoring did dip when the knockouts began — 2.99 in the groups to 2.62 in the round of 32 — then climbed back through the round of 16 (2.88) and the quarterfinals (3.00, above the group rate). Pooled, the 32 knockout games finished at 2.91 goals per game, a whisker under the groups' 2.99 — but that pooled figure hides a ten-goal third-place game (France 4–6 England, the classic dead-rubber goal-fest). Strip that one famous outlier and the 31 competitive knockouts sit at 2.68 — a real tightening, about a third of a goal per game, but nothing like the strangled football the cliché promises. And the one genuinely tight game was the biggest: the final, Spain 1–0 Argentina.
-
Chart it, with the sample sizes on the bars
These numbers deserve a chart with a warning label: the stages have wildly different sample sizes (72 games down to a single match), so print
non every bar. That ten-goal spike at "third place" is one game, and the bar says so on its face — a rate from one match is a scoreline, not a scoring environment. The same discipline that keeps an 8-game rate honest keeps a 1-game rate from lying to you.python fig, ax = plt.subplots(figsize=(10.2, 5.6)) bars = ax.bar(by_stage.index, by_stage["goals_per_game"]) for b, (_, row) in zip(bars, by_stage.iterrows()): ax.annotate("n=%d" % row["games"], (b.get_x() + b.get_width()/2, 0.22), ha="center") ax.axhline(df["total_goals"].mean(), ls="--") # tournament averageData: Bundled (complete real 2026 World Cup results, ESPN public data), retrieved July 2026 -
Interrogate the cliché's strongest prediction: 0-0s
If knockouts really strangle football, goalless games should pile up there — teams playing for penalties. Count them by stage.
python zeros = df[df["goalless"]] print(zeros.groupby("stage").size())Where the 0-0s actually liveGoalless games: 8 of 104 (8%) stage group 7 round of 32 0 round of 16 1 quarterfinal 0 semifinal 0 third place 0 final 0 The cliche says knockouts breed 0-0s. The full tournament: 7 in 72 group games, 1 in 32 knockout games - elimination football stayed DECISIVE, not cagey.
Seven of the tournament's eight goalless games happened in the group stage. The knockouts produced exactly one 0-0 in 32 elimination games — the last round-of-16 tie, settled on penalties — and then the tournament closed with eight straight knockout games that all had goals, including that ten-goal third-place match. Over the full 2026 World Cup, elimination football was decisive, not cagey — the opposite of the cliché's strongest claim.
Troubleshooting
My stages come out in alphabetical order
groupby sorts group keys alphabetically by default, which puts "final" before "group" before "round of 16" before "round of 32" — tournament nonsense. That's what the .reindex(stage_order) is for: it reorders the result to the list you give it. The alternative is converting the column to an ordered pd.Categorical, which also fixes plots.
agg raises KeyError on my column names
Named aggregation's tuples are (column, function) — the first element must be a real column in the DataFrame, after your derives. If you renamed total_goals or skipped the derive step, the groupby can't find it. Print df.columns before aggregating.
Why do both_scored means look like 0.542 instead of percentages?
The mean of a boolean column is the share of True values, as a proportion. Multiply by 100 at display time if you want percent — keeping the underlying number a proportion makes later math (like pooling stages) simpler and safer.
Do knockout scores include extra time?
Yes — each row carries the final score when the whistle ended play, including extra time where it was played. Penalty shootouts are not goals, which is why a match decided on penalties can sit in the data as a draw (the round-of-16 0-0 is exactly that). If your question is "goals scored", that's the honest accounting; just say so in your caption.
Challenge yourself
Add a margin column (absolute goal difference) and aggregate it by stage — did the knockout football get closer even where it didn't get lower-scoring? Then split the group stage by matchday (each team's 1st, 2nd, 3rd game — you can derive it with groupby.cumcount() per team) and test the folk claim that third group games go quiet once qualification is settled. Finally, rerun the whole analysis with the third-place game excluded and watch how much one match can move a 32-game pooled average: that sensitivity check is the whole point of writing analysis as code instead of doing it once in a spreadsheet.
Get the code
Here's the complete, working script for this tutorial. It runs exactly as shown.
Download the finished script (81_world_cup_goals_by_stage.py)This script imports a small shared helper (and reads any bundled sample data) that live next to it in /downloads/ — grab these into the same folder so it runs as-is: sdt_common.py. Or skip the collecting: the Soccer Analytics with StatsBomb & xG bundle has this whole course’s scripts and data in one ZIP.