Pull Your First Match Data with StatsBomb Open Data
Part 4 of 6 in Working with Real Sports APIs · course bundle (code + data)
What you'll build
Event data for a real match, summarized into a shots-and-events breakdown.
Most soccer data online stops where it gets interesting: who scored, who won, final whistle. StatsBomb hands you the opposite - a record of every single thing that happened on the pitch, pass by pass, tackle by tackle, shot by shot, each one stamped with a location and a time. And they give a generous chunk of it away for free. We'll install statsbombpy, poke through the free matches on offer, and pick one of the most famous games ever played - the 2018 World Cup final - to load in full. The thing I want to land for you is the idea the whole soccer side of this site stands on: in event data, every row is one event. Get comfortable with that and pass maps, shot maps, and xG tables all stop being mysterious.
This is the gateway to the soccer side of this site. Once you can load events, you can build pass maps, shot maps, and xG tables - all of which start exactly here. If you're newer to pandas, the twelve core pandas operations tutorial will make every step below feel familiar.
One thing up front, and it's not optional: StatsBomb releases this data under a free license that requires attribution. Any chart or table you publish from it must credit StatsBomb. We'll bake that credit into our chart at the end, and I'll remind you again there - please don't skip it.
-
Install statsbombpy and import it
StatsBomb's open data lives in a public GitHub repository as a pile of JSON files. You could download and parse them by hand, but the
statsbombpypackage does all of that for you and hands back tidy pandas DataFrames. Install it once from your terminal:python pip install statsbombpyThen import the
sbobject - that's your entry point to everything - alongside matplotlib for the chart we'll draw later.python import matplotlib.pyplot as plt from statsbombpy import sbThe first time you call any
sbfunction it reaches out to GitHub over the network, so you'll want to be online. Results are cached after that. -
See what's available
Before you can load a match you need to know what StatsBomb has released. The
competitions()call returns one row per competition-season - a particular league or tournament in a particular year. There are dozens of them, from the men's World Cup to the Women's Super League, and the list grows over time.python comps = sb.competitions() cols = ["competition_name", "season_name", "competition_id", "season_id"] print(f"{len(comps)} competition-seasons available. A few:") print(comps[cols].drop_duplicates("competition_name").head(8))A sample of free competitions80 competition-seasons available. A few: competition_name season_name competition_id season_id 0 1. Bundesliga 2023/2024 9 281 2 African Cup of Nations 2023 1267 107 3 Champions League 2018/2019 16 4 21 Copa America 2024 223 282 22 Copa del Rey 1983/1984 87 84 25 FA Women's Super League 2023/2024 37 281 29 FIFA U20 World Cup 1979 1470 274 30 FIFA World Cup 2022 43 106The two columns that matter most are
competition_idandseason_id. Those number pairs are how you ask for a specific tournament. Notice the bottom row: the FIFA World Cup carriescompetition_id43. That's the one we want - we just need the right season alongside it. -
Pick the 2018 World Cup final
The 2018 men's World Cup is competition 43, season 3. We pass that pair to
matches()to get every game in the tournament, then filter down to the single match whosecompetition_stageis the Final. Using.iloc[0]grabs that one row as a pandas Series so we can read individual fields off it.python matches = sb.matches(competition_id=43, season_id=3) final = matches[matches["competition_stage"] == "Final"].iloc[0] match_id = int(final["match_id"]) print(f"The final: {final['home_team']} {final['home_score']}" f"-{final['away_score']} {final['away_team']} (match_id {match_id})")OutputThe final: France 4-2 Croatia (match_id 8658)
There it is: France 4, Croatia 2. The
match_idprinted alongside - 8658 - is the key we'll use to pull the event data. Every match in the StatsBomb universe has a unique id like this, and once you have it, the door is open. -
Load every event
This is the moment the data gets interesting. One call to
sb.events(match_id)returns a DataFrame where each row is a single event - one pass, one shot, one tackle, one throw-in. A full match has thousands of them. Let's load the final and peek at a few, keeping only the columns that read cleanly and dropping rows with no associated player (those are administrative events like the half starting).python events = sb.events(match_id) print("Events in the match:", len(events)) print(events[["minute", "team", "type", "player"]].dropna(subset=["player"]).head(8))The first events of the matchEvents in the match: 2978 minute team type player 6 0 Croatia Pass Mario Mandžukić 7 0 Croatia Pass Marcelo Brozović 8 0 Croatia Pass Luka Modrić 9 0 Croatia Pass Šime Vrsaljko 10 0 Croatia Pass Danijel Subašić 11 0 France Pass Raphaël Varane 12 0 Croatia Pass Ivan Perišić 13 0 Croatia Pass Ivan RakitićRead those rows like a stenographer's transcript of the opening seconds. Mario Mandžukić plays a pass, then Marcelo Brozović, then Luka Modrić - Croatia is knocking the ball around in the first minute, and the data captured every touch. That mental model is the whole game: an event DataFrame is a chronological list of everything that happened, and the
typecolumn tells you what each thing was. -
Summarize the event types
Nearly 3,000 events is a lot to stare at. The fastest way to understand the shape of a match is to ask: how many of each type of event were there? The
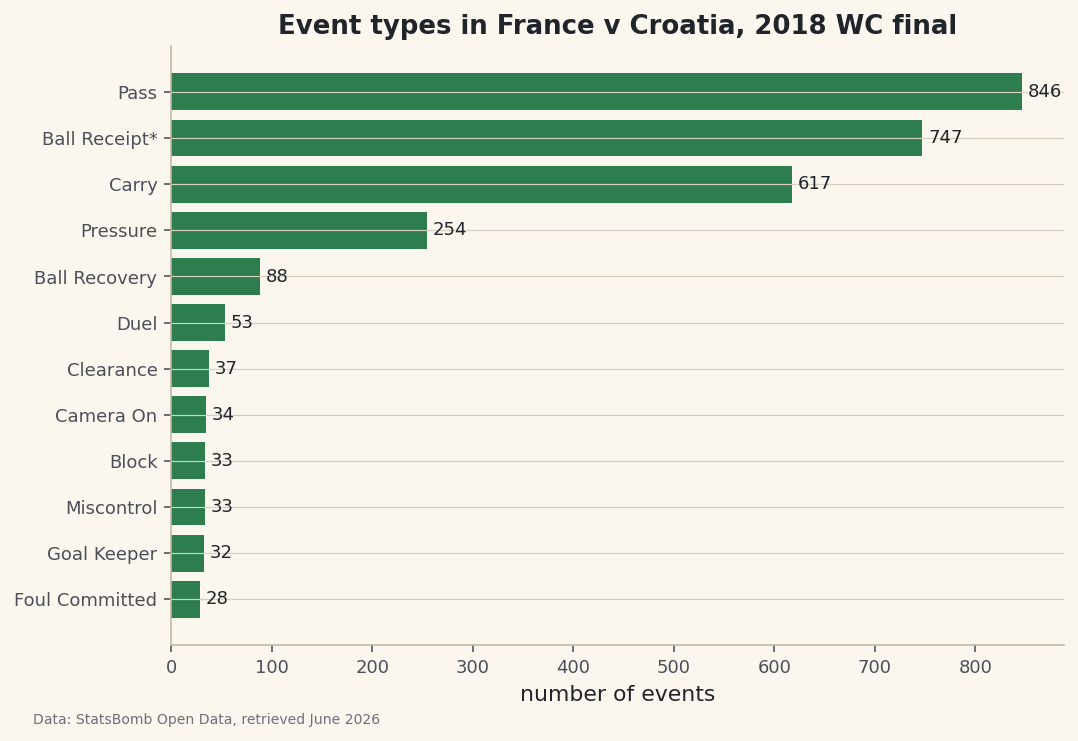
value_counts()method does exactly that - it tallies how often each distinct value appears in thetypecolumn. We keep the twelve most common and sort them so the chart reads cleanly.python counts = events["type"].value_counts().head(12).sort_values()It will be no surprise that passes dominate - soccer is mostly passing - followed by ball receipts, pressures, and carries. Shots, the events everyone remembers, are rare by comparison. Let's turn that tally into a horizontal bar chart so the proportions are obvious at a glance.
python fig, ax = plt.subplots(figsize=(8, 5.4)) ax.barh(counts.index, counts.values, color="#3A7D44") ax.bar_label(ax.containers[0], padding=3, fontsize=9) ax.set_title("Event types in France v Croatia, 2018 WC final") ax.set_xlabel("number of events") fig.savefig("events_by_type.png", dpi=144, bbox_inches="tight")Data: StatsBomb Open Data, retrieved June 2026 And here is the attribution payoff: because we built a published chart from StatsBomb data, the figure credits StatsBomb Open Data in its caption. Whenever you share a chart made from this source - a blog post, a tweet, a slide - that credit has to ride along. It's the price of admission, and it's a fair one for data this good.
Troubleshooting
ModuleNotFoundError: No module named 'statsbombpy'
The package isn't installed in the environment you're running. Run pip install statsbombpy in the same terminal you launch Python from. If you use virtual environments, make sure it's activated first - installing into the wrong environment is the most common cause of this error.
A ConnectionError or timeout on the first call
The first sb call downloads from GitHub, so you need a live internet connection. A corporate proxy or firewall can also block it. Try again on an unrestricted network, and confirm you can reach github.com in a browser.
An IndexError on .iloc[0]
This means the filter returned no rows - usually a typo in the stage name. The value must match exactly, including capitalization: it's "Final", not "final". Print matches["competition_stage"].unique() to see the exact strings available for that tournament.
Challenge yourself
Swap in a different match and re-run everything. Pick any competition from the list in step 2, find a match id with sb.matches(), and load its events - no other code needs to change, which is the whole point of a clean pipeline. Then go one level deeper: filter the events to just type == "Shot" and print which players took them. That short list is the seed of a shot map, which is exactly where the pass map tutorial picks up.
Get the code
Want it all in one file? This is the exact script that produced the outputs above.
Download the finished script (12_pull_your_first_match_data_with_statsbomb.py)This script imports a small shared helper (and reads any bundled sample data) that live next to it in /downloads/ — grab these into the same folder so it runs as-is: sdt_common.py. Or skip the collecting: the Working with Real Sports APIs bundle has this whole course’s scripts and data in one ZIP.