Baseball
Beginner
Pull Your First MLB Data with pybaseball
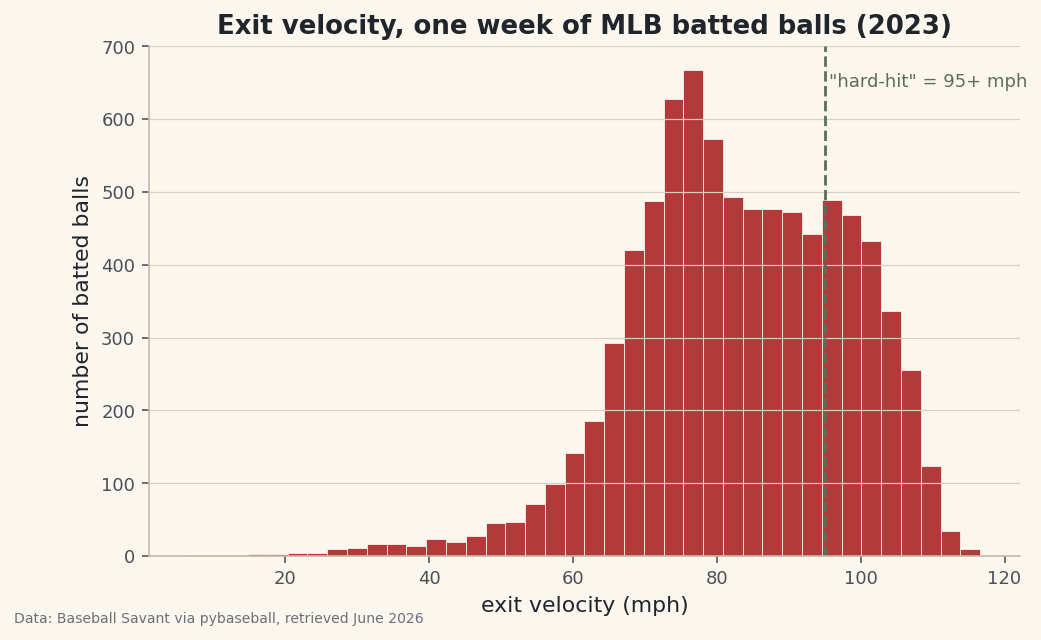
Install pybaseball, turn on caching, and pull a week of real Statcast data — ending with an exit-velocity histogram that proves the data is really there.
MLB Statcast is the richest free data in sports. Pull it with pybaseball and build leaderboards, heatmaps and more.
Start with the pybaseball first-pull tutorial to get real Statcast data flowing, then the Pythagorean expected-standings tutorial to learn the win-expectation toolkit. From there the exit-velocity leaderboard, pitch-location heatmap and spray-chart builds are independent — pick whichever output you want to own first. If an API ever misbehaves, the bundled sample data keeps every tutorial runnable offline.
No tutorials match that filter.
Install pybaseball, turn on caching, and pull a week of real Statcast data — ending with an exit-velocity histogram that proves the data is really there.
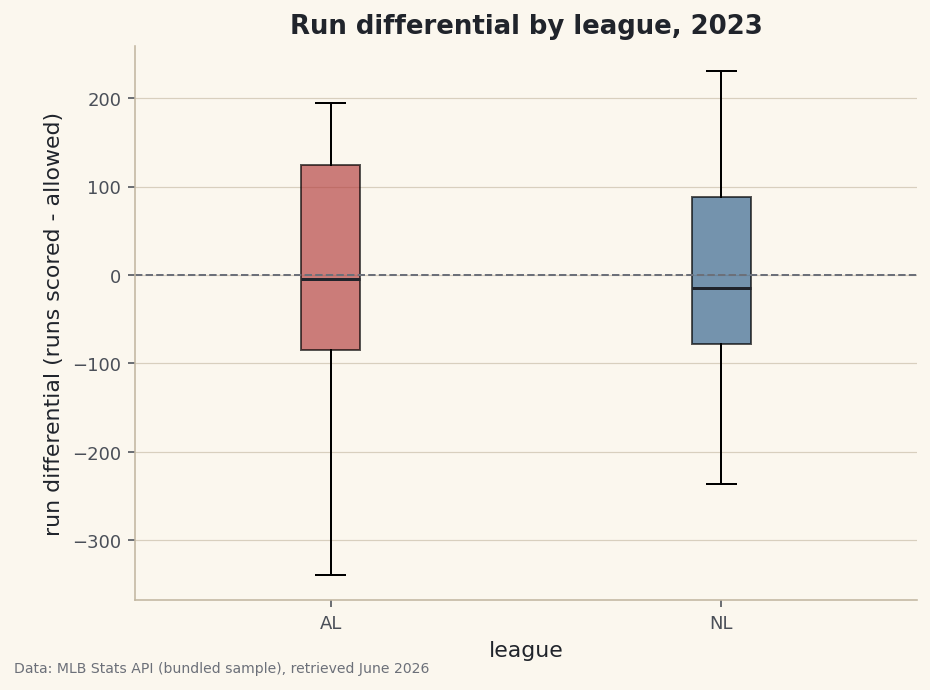
Averages hide spread. Build a box plot comparing the AL and NL run-differential distributions at once — median, quartiles, and outliers in one figure.
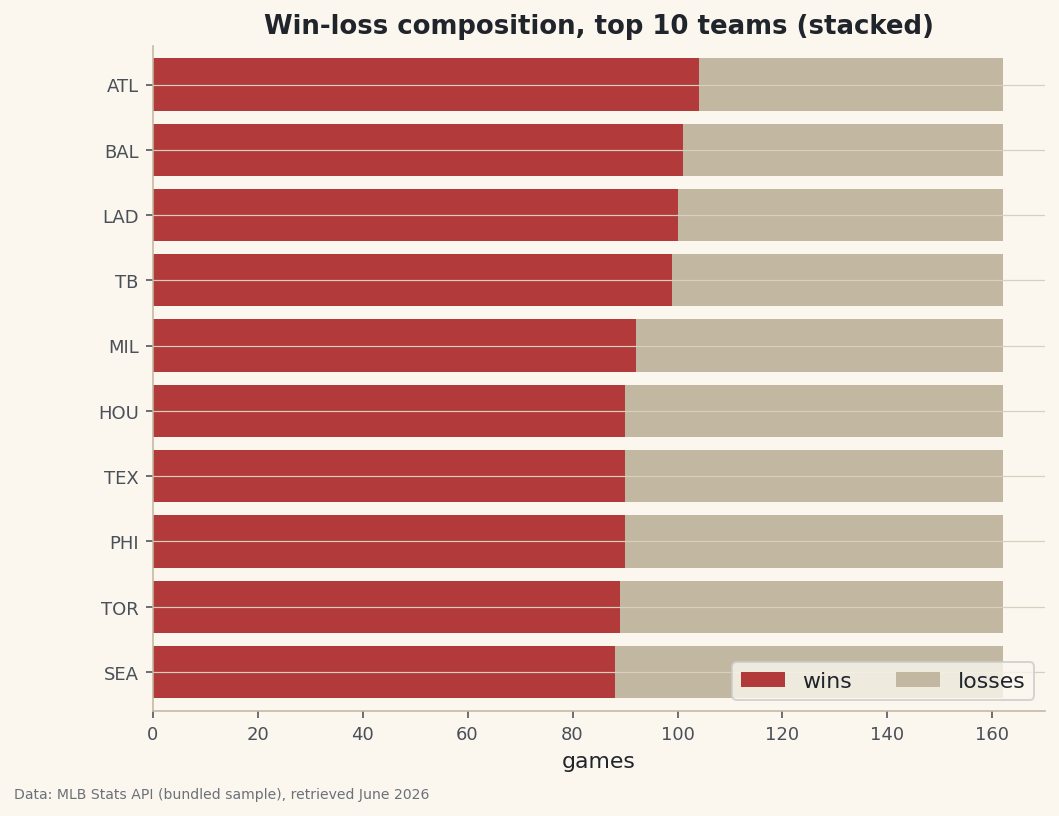
Stack wins and losses into one bar per team to show composition — and learn when stacking clarifies a comparison and when it just muddies the picture.
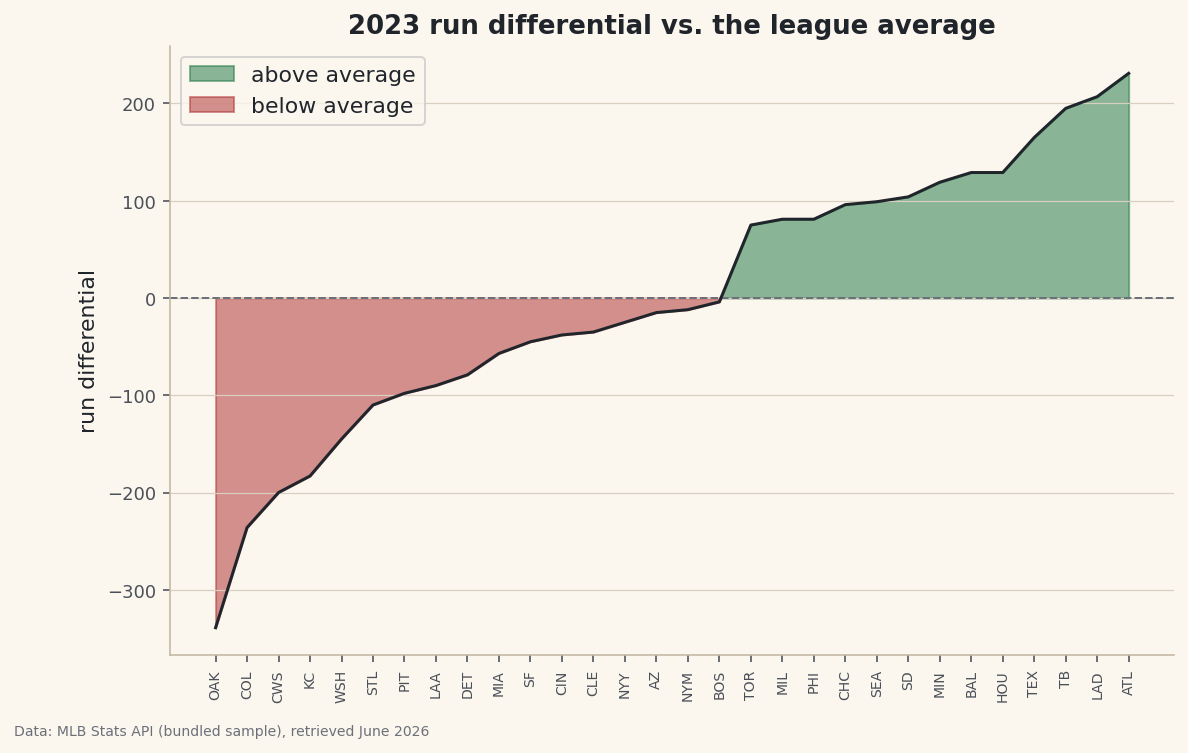
fill_between() paints the area between two lines; its where= mask colors above- and below-average regions differently, with interpolate=True closing the wedge.
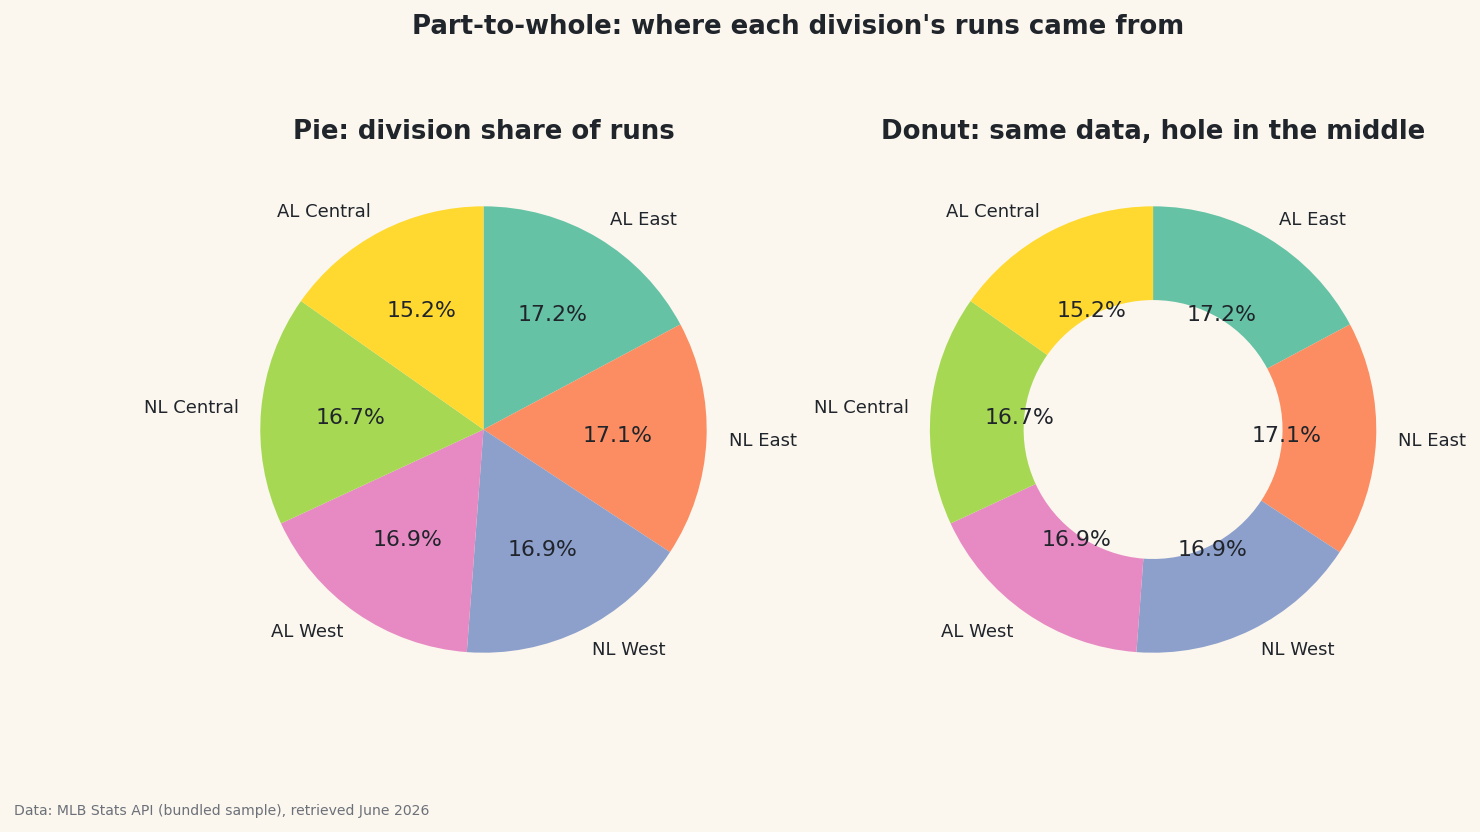
Build a pie and a donut of each division's share of runs, then learn the situations — close values or many slices — where a bar chart is the honest choice.
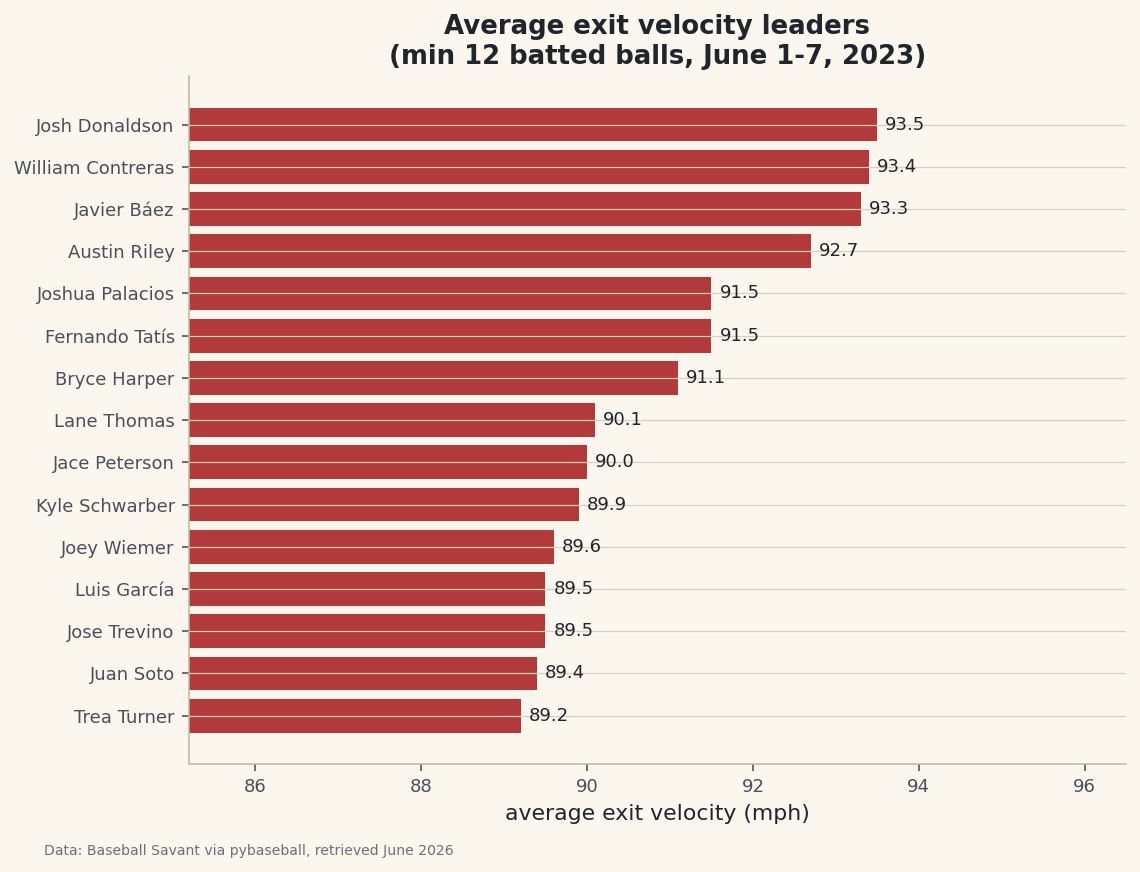
Pull a week of batted-ball data with pybaseball, then group, aggregate, and rank hitters by average and max exit velocity into a clean, publishable leaderboard.
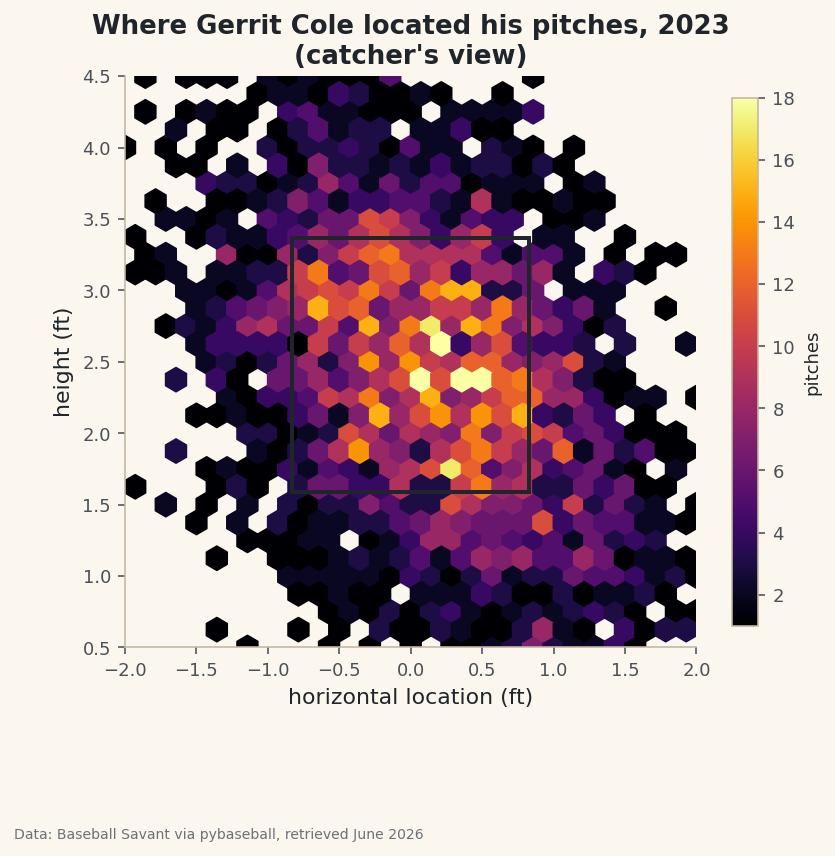
Use a single pitcher's Statcast data to build a 2-D location heatmap, draw the strike zone from the catcher's view, and read what the hot spots tell you.
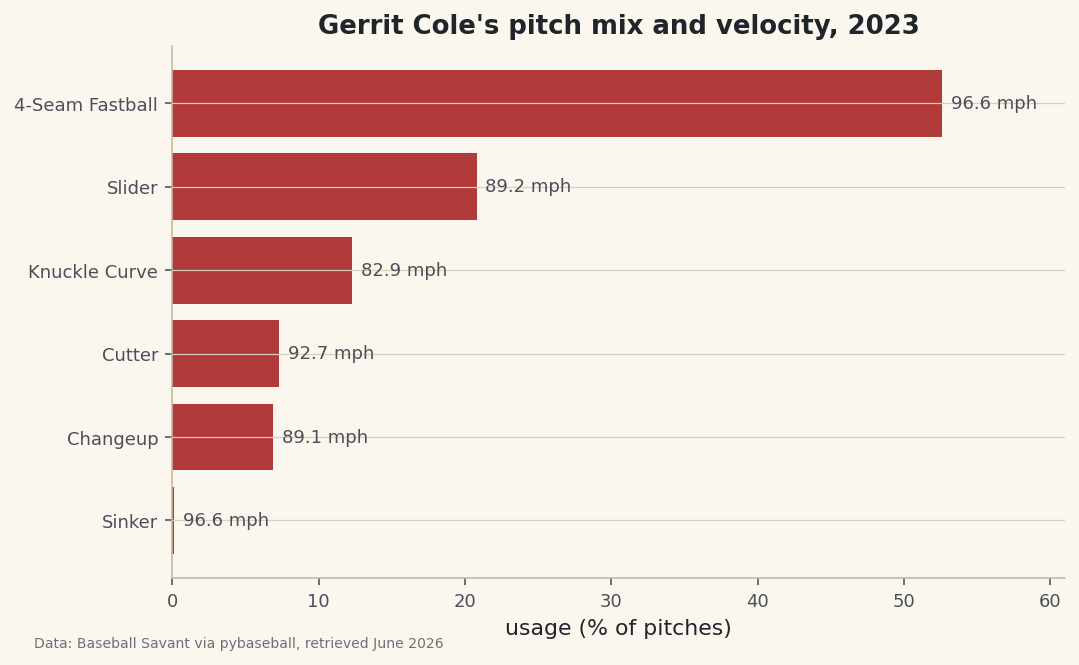
Use one pitcher's Statcast season to break down his pitch mix, average velocity, and spin by pitch type - the scouting report you can build yourself in a few lines.
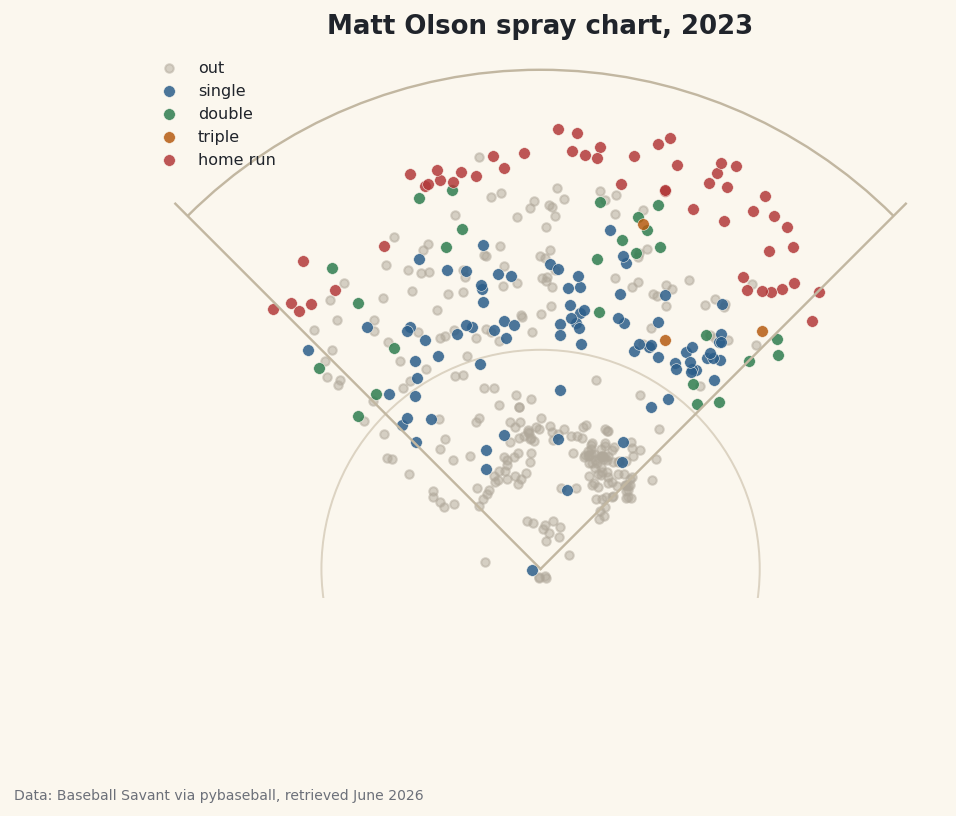
Turn Statcast hit coordinates into a spray chart on a field you draw yourself, colored by outcome, to see whether a hitter pulls or uses the whole field.
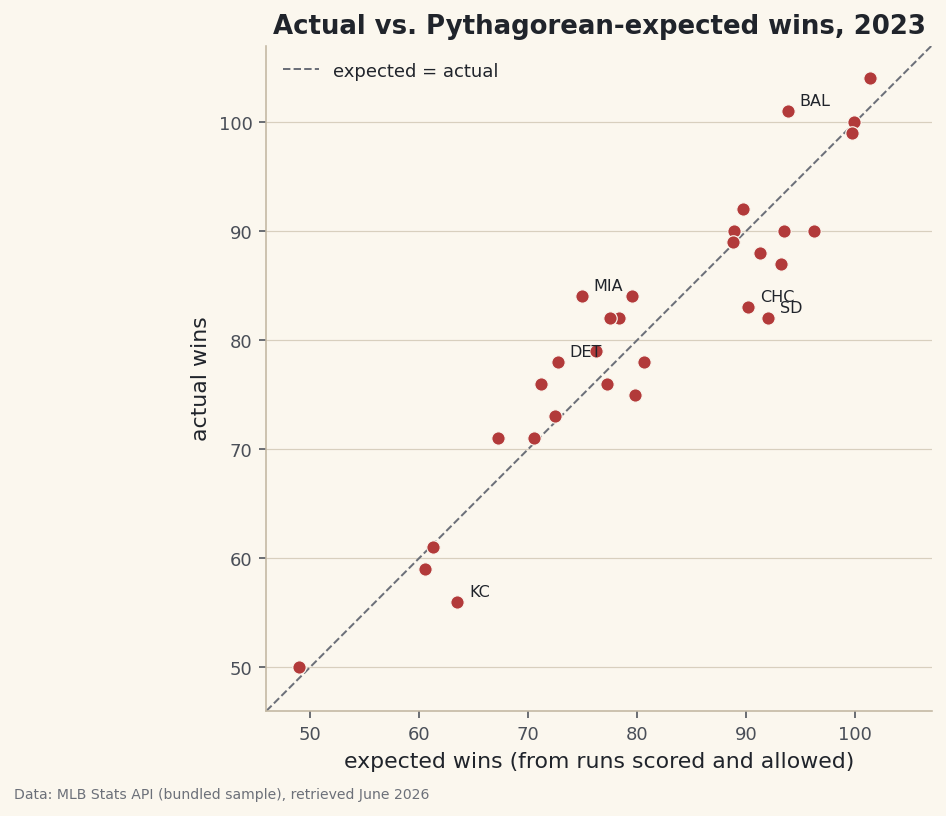
Turn runs scored and allowed into expected wins with the Pythagorean formula, then plot which 2023 MLB teams over- and under-performed their run math.
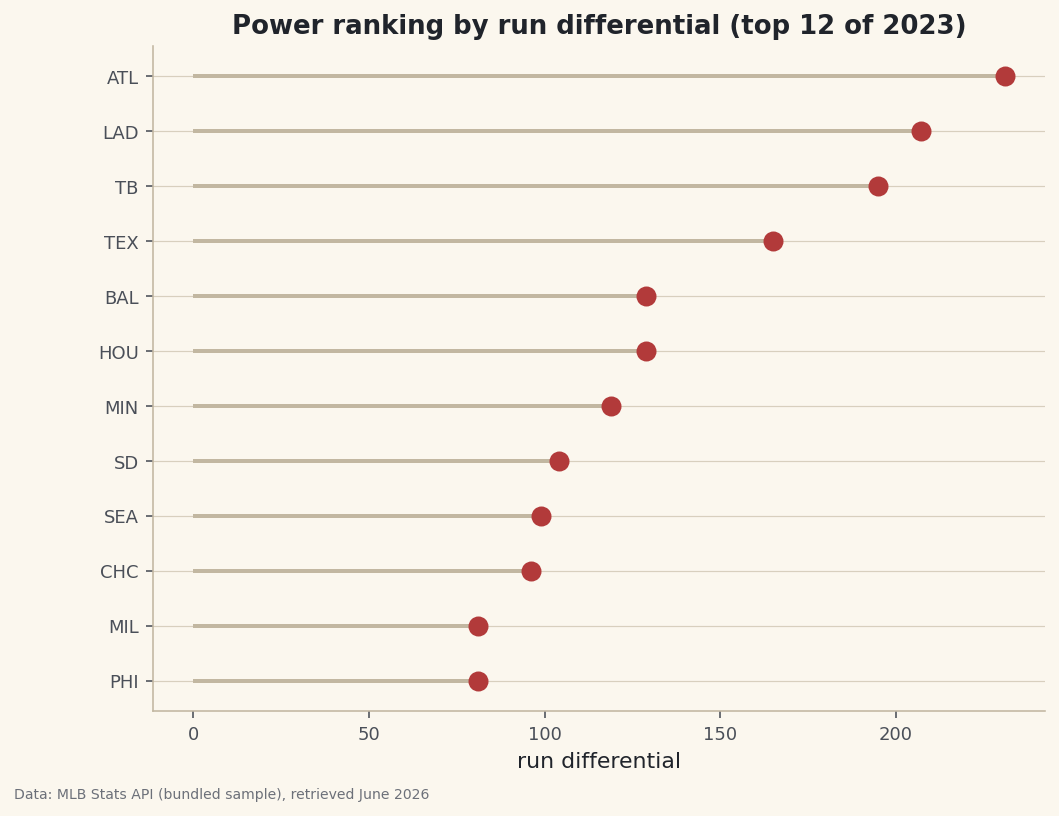
Turn a column into a ranking with rank(), handle ties the right way, and draw a lollipop chart - a cleaner alternative to bars when the order is the story.
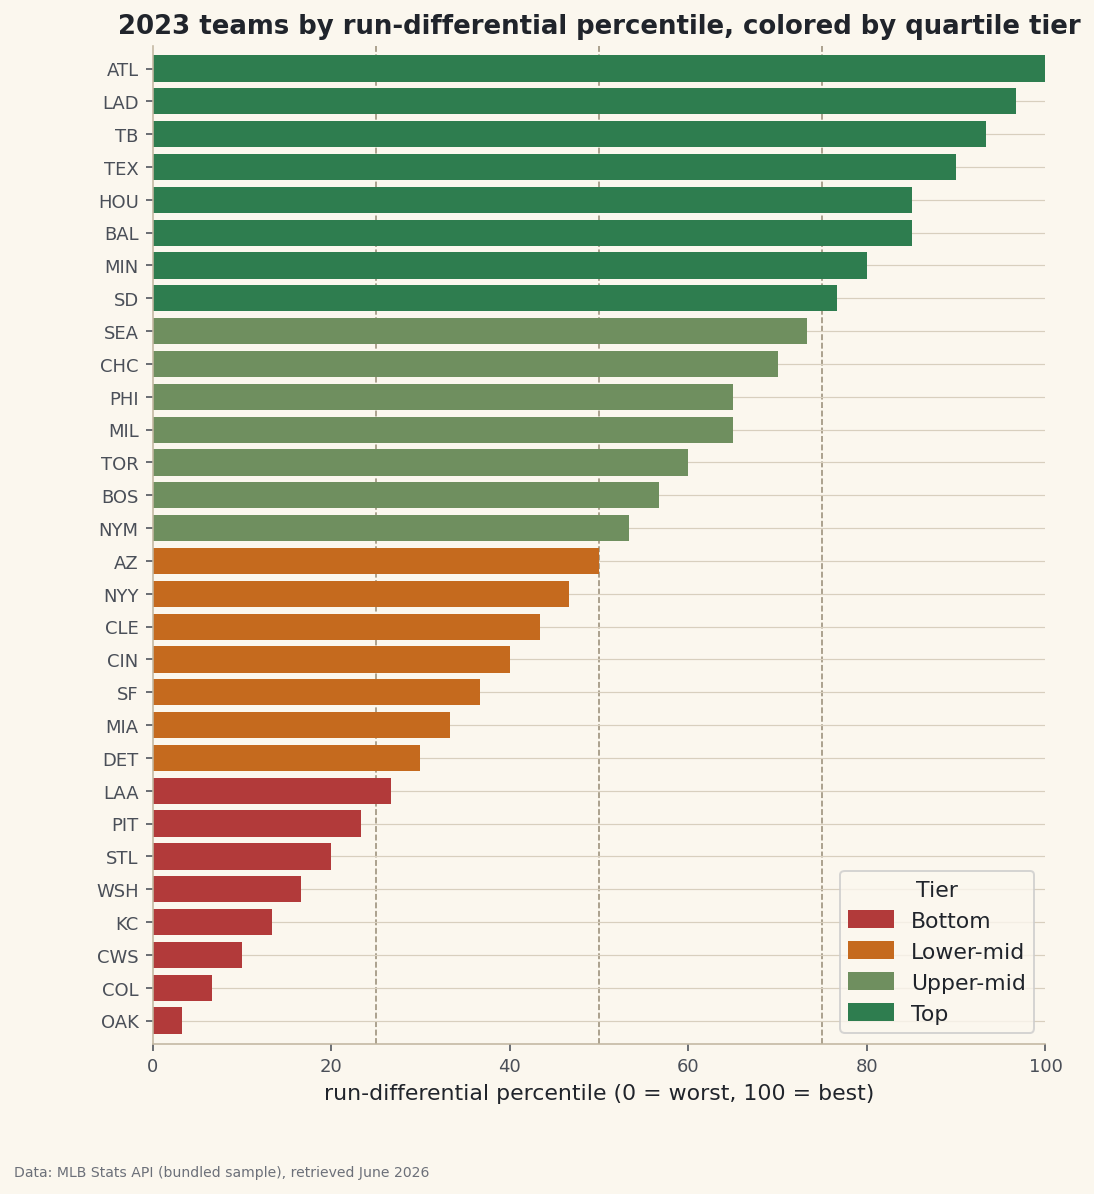
A raw rank says 8th of 30; a percentile rank says 73rd percentile. Use rank(pct=True) and qcut() to score teams and bin them into quartile tiers.
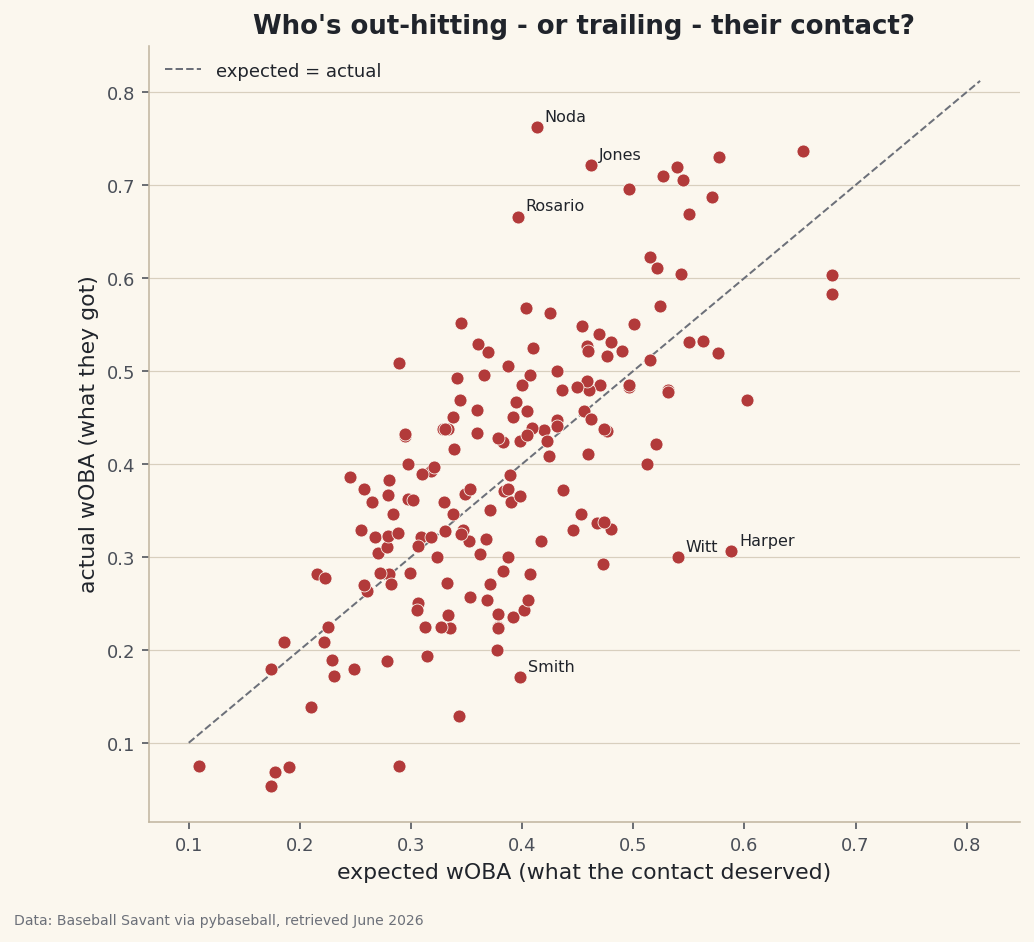
Statcast's expected stats model what should have happened from launch speed and angle. Compare expected to actual wOBA to find who's been unlucky - or living right.
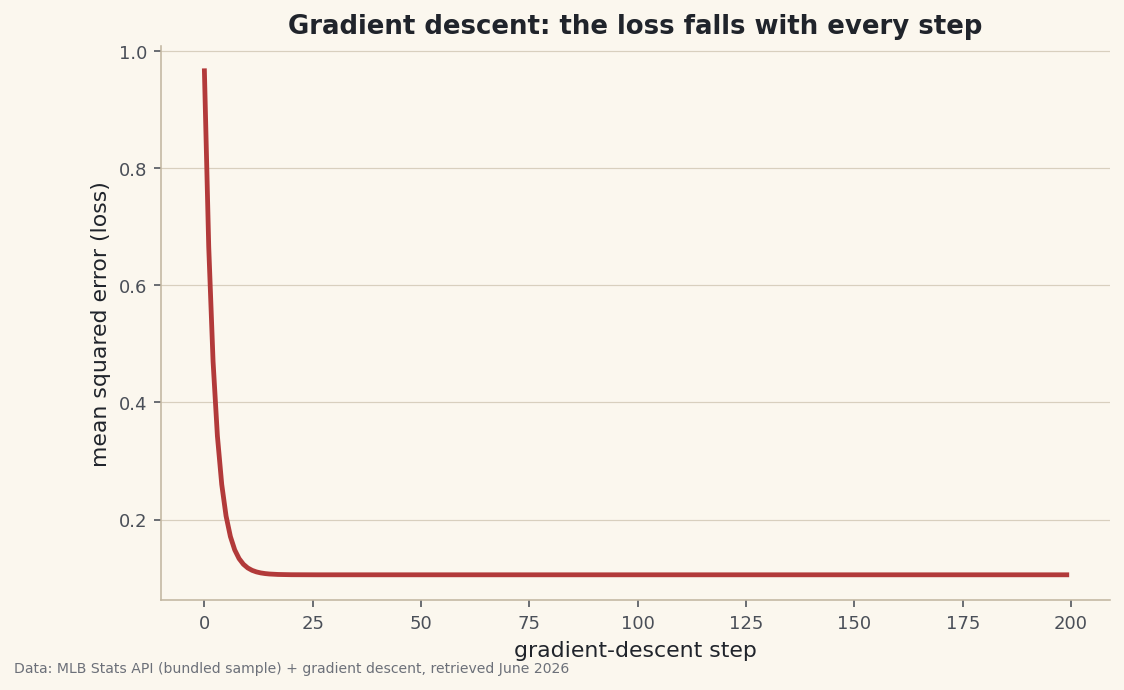
Fit wins from run differential by stepping downhill on the error surface in pure numpy — the loss falls from 0.97 to 0.11 and lands on polyfit's exact line.
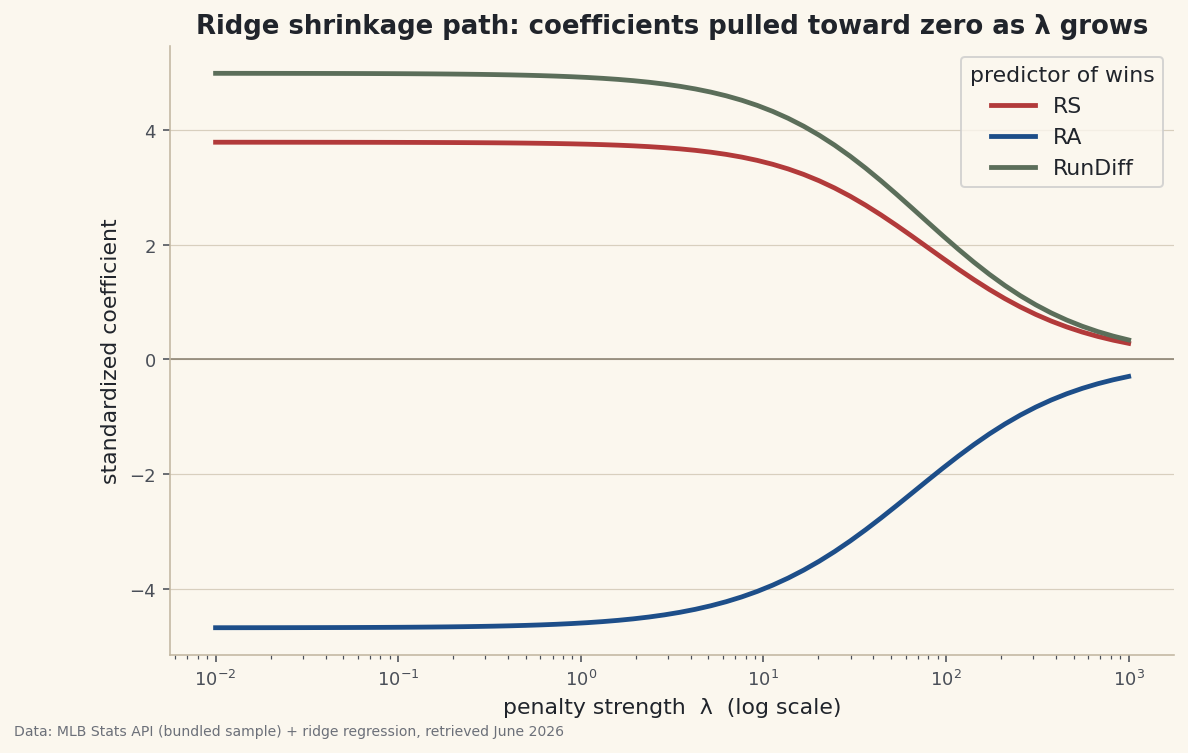
Three exactly collinear MLB predictors make plain OLS unsolvable. Build the closed-form ridge estimator in numpy, watch it succeed, and read the shrinkage path.