Ranking Teams: Build a Power Ranking with rank()
Part 7 of 7 in Baseball Analytics with Statcast · course bundle (code + data)
What you'll build
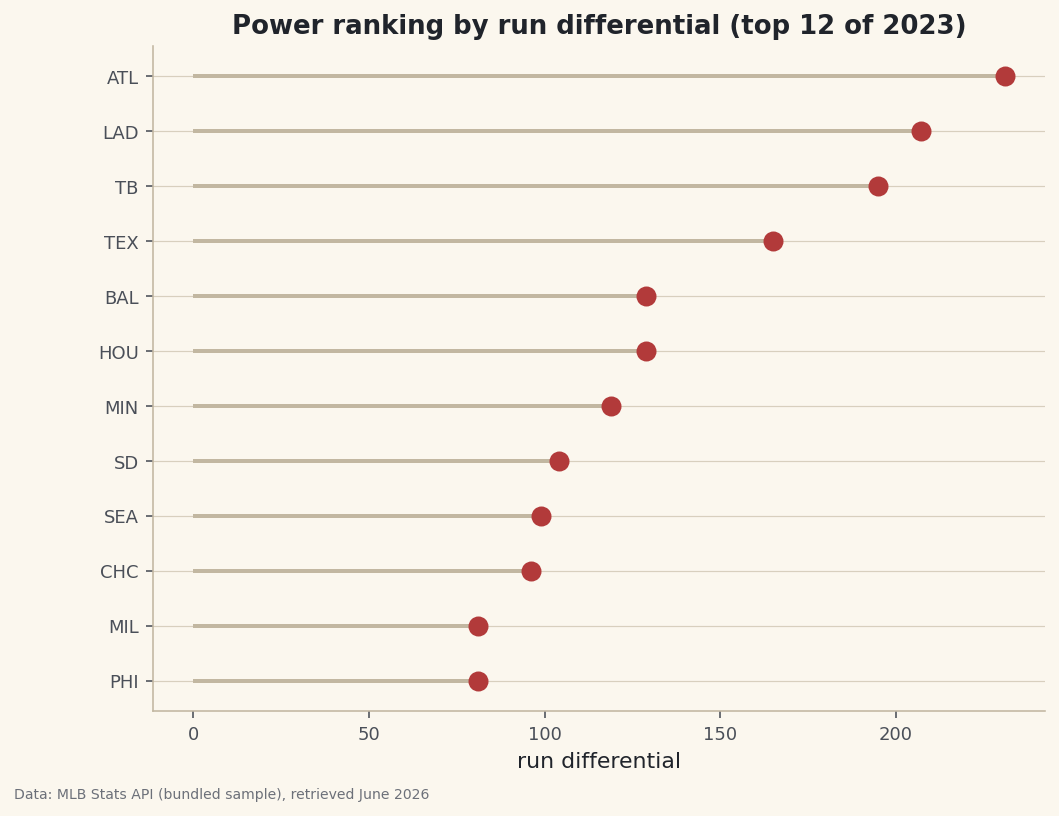
A run-differential power ranking, drawn as a lollipop chart.
What happens when two teams tie? Sorting just shrugs and picks an order; ranking has to answer it explicitly — and the tie-breaking option people reach for first is usually the wrong one. We'll build a power ranking of MLB teams by run differential with pandas' rank(), walk through which tie-breaker actually does what you mean, and finish with a lollipop chart — a cleaner alternative to bars when the ordering is the entire point.
This builds on Summary Statistics and Distributions. Everything here runs on the bundled sample_standings.csv, a real copy of the 2023 MLB standings, fully offline.
-
Turn a column into a ranking
rank()assigns each row its position. By default it ranks ascending (smallest = 1), so for a power ranking we rank descending — the biggest run differential is number one.python import pandas as pd df = pd.read_csv("sample_standings.csv") df["Rank"] = df["RunDiff"].rank(ascending=False, method="min").astype(int) print(df.sort_values("Rank")[["Rank", "Team", "W", "RunDiff"]].head(8).to_string())Power ranking by run differentialRank Team W RunDiff 0 1 Braves 104 231 2 2 Dodgers 100 207 3 3 Rays 99 195 7 4 Rangers 90 165 1 5 Orioles 101 129 5 5 Astros 90 129 10 7 Twins 87 119 14 8 Padres 82 104
The Braves top the board at +231, and the order tracks quality closely. Look at the tie: the Orioles and Astros both finished at +129, so both get rank 5 — and the next team is rank 7, not 6. That's the
method="min"rule at work, and it's the convention sports standings use. -
Ties: pick the right method
How
rank()breaks ties is the setting people forget. The main options:method="min"— tied rows share the lowest rank (two 5ths, then a 7th). The standings convention.method="dense"— like min, but the next rank isn't skipped (two 5ths, then a 6th).method="average"— the default; tied rows get the average of the ranks they span (two would-be 5th/6th rows both become 5.5).
None is "correct" in the abstract — they answer slightly different questions — but choosing without thinking is how rankings end up subtly wrong.
-
Draw a lollipop chart
A lollipop chart is a bar chart on a diet: a thin stem from zero to each value, capped by a dot. When the message is the ranking rather than precise magnitudes, it's less ink and easier to read than fat bars.
python import matplotlib.pyplot as plt top = df.sort_values("RunDiff", ascending=False).head(12).sort_values("RunDiff").reset_index(drop=True) y = range(len(top)) fig, ax = plt.subplots(figsize=(8, 6)) ax.hlines(y=list(y), xmin=0, xmax=top["RunDiff"], color="#C2B7A1", lw=2) # the stems ax.plot(top["RunDiff"], list(y), "o", markersize=9) # the candy ax.set_yticks(list(y)); ax.set_yticklabels(top["Abbr"]) ax.set_xlabel("run differential") fig.savefig("power_lollipop.png", dpi=144, bbox_inches="tight")Data: Bundled sample (2023 MLB standings), retrieved June 2026 Two layers make the lollipop:
hlinesdraws the stems from zero out to each value, andplot(..., "o")drops the dots on the ends. Sorting the slice ascending puts the best team on top, and the eye runs straight down the dots to read the ranking.
Troubleshooting
My number 1 is the worst team
rank() defaults to ascending, which makes the smallest value rank 1. Pass ascending=False so the biggest run differential is number one.
Tied teams show decimal ranks like 5.5
That's the default method="average". For whole-number standings ranks, pass method="min" (or "dense" if you don't want to skip the next number).
The lollipop dots and stems don't line up
The stems and the dots must share the same y-positions and the same order. Build one y = range(len(top)) and pass it to both hlines and plot, and set the labels with set_yticklabels after sorting the slice.
Challenge yourself
Build a composite power ranking: rank teams separately by runs scored and by runs allowed, then average the two rank columns into an overall score and re-rank that. Does a balanced team that's good (but not elite) on both ends climb above a lopsided one? Color the lollipop dots by league to see whether the AL or NL stacked the top of the board.
Get the code
Here's the complete, working script for this tutorial. It runs exactly as shown.
Download the finished script (49_ranking_teams_power_ranking.py)This script imports a small shared helper (and reads any bundled sample data) that live next to it in /downloads/ — grab these into the same folder so it runs as-is: sdt_common.py. Or skip the collecting: the Baseball Analytics with Statcast bundle has this whole course’s scripts and data in one ZIP.