Profile a Pitcher: Pitch Mix and Velocity with Statcast
Part 3 of 7 in Baseball Analytics with Statcast · course bundle (code + data)
What you'll build
A pitcher's arsenal: how often he throws each pitch and how hard.
Before a hitter steps in the box, an advance scout has already answered three questions about the pitcher on the mound: what does he throw, how often, and how hard? That short answer - the pitch mix - is the scouting backbone of modern baseball, and you can rebuild it for a full season from raw Statcast data. I'll pull every pitch one starter threw in 2023, group those pitches by type, and read off the usage, velocity, and spin of each offering. The subject is Gerrit Cole, who happened to win the AL Cy Young that year.
This builds directly on your first pybaseball pull, so if you've run that, the library is installed and your cache is warm. The only new pandas idea is the one that powers nearly every player report you'll ever write: groupby plus a multi-column agg. The data is Baseball Savant via pybaseball, retrieved June 2026.
-
Pull one pitcher's whole season
In the leaderboard tutorial we used
statcast()to grab every pitch in the league across a week. Here we want the opposite: every pitch from one pitcher across a whole season. The functionstatcast_pitcher(start, end, player_id)does exactly that, and because Savant only has to return a single player it stays fast even over six months.python import matplotlib.pyplot as plt import pybaseball as pyb pyb.cache.enable() PITCHER_ID = 543037 # Gerrit Cole pitches = pyb.statcast_pitcher("2023-04-01", "2023-09-30", PITCHER_ID) pitches = pitches.dropna(subset=["pitch_name", "release_speed"])That
543037is Cole's MLBAM ID - Statcast identifies players by number, not name. We drop any pitch missing a name or a release speed right away, because a row with no pitch type can't be grouped and a row with no velocity would poison the averages we're about to take. The troubleshooting section shows how to look up any other pitcher's ID. -
Turn the ID into a name
We'll want a real name for our table title and chart, not a number. pybaseball ships a reverse lookup that translates MLBAM IDs back into names; we pass it a one-element list and pull the first (and only) row off the result.
python name_row = pyb.playerid_reverse_lookup([PITCHER_ID], key_type="mlbam").iloc[0] pitcher = f"{name_row['name_first'].title()} {name_row['name_last'].title()}"The lookup returns separate
name_firstandname_lastcolumns in lowercase, so we.title()each one and join them with a space. The.iloc[0]grabs the single matching row as a Series, which lets us index it by column name. The first time you call this it builds a lookup table and can take a few seconds; after that it's cached. -
Build the arsenal table
This is the heart of the whole report.
groupby("pitch_name")splits the season into one bucket per pitch type - all the fastballs together, all the sliders together, and so on. Then a singleaggcomputes three numbers for each bucket at once: how many of that pitch he threw, its average velocity, and its average spin rate.python mix = (pitches.groupby("pitch_name") .agg(count=("release_speed", "size"), avg_velo=("release_speed", "mean"), avg_spin=("release_spin_rate", "mean")) .sort_values("count", ascending=False))The named-aggregation syntax -
avg_velo=("release_speed", "mean")- reads as "make a column calledavg_veloby taking the mean ofrelease_speed." Using"size"as the aggregation forcountjust tallies the rows in each bucket; the column you point it at doesn't matter for a size count, only the group does. Sorting bycountdescending puts his bread-and-butter pitch on top. -
Add a usage percentage and round
A raw pitch count is hard to read across pitchers who throw different totals, so we convert it to a share of the arsenal. Dividing each pitch's count by the column's sum gives a fraction; multiplying by 100 makes it a percentage.
python mix["usage%"] = (100 * mix["count"] / mix["count"].sum()).round(1) mix = mix.round({"avg_velo": 1, "avg_spin": 0})The trick worth remembering is
mix["count"] / mix["count"].sum(): pandas divides every element of the column by the single total, so one line turns counts into shares. We round usage and velocity to one decimal and spin to a whole number with a per-column dictionary passed to.round()- spin rates in the thousands don't need decimals. -
Read the arsenal
Here's the finished scouting table. We print the four columns that matter in scouting order - how many, how often, how hard, how much spin.
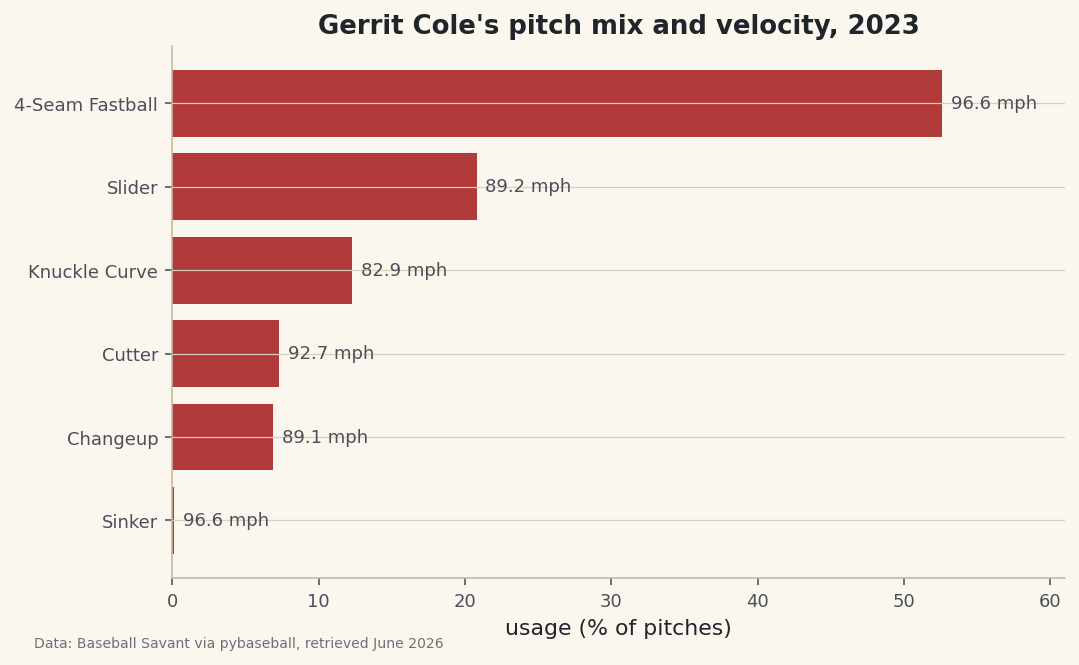
python print(f"{pitcher}, 2023 arsenal:") print(mix[["count", "usage%", "avg_velo", "avg_spin"]].to_string())Gerrit Cole's 2023 arsenalGerrit Cole, 2023 arsenal: count usage% avg_velo avg_spin pitch_name 4-Seam Fastball 1675 52.6 96.6 2411.0 Slider 664 20.8 89.2 2542.0 Knuckle Curve 392 12.3 82.9 2784.0 Cutter 234 7.3 92.7 2512.0 Changeup 219 6.9 89.1 1577.0 Sinker 2 0.1 96.6 2349.0This is a textbook power-pitcher profile, which is how you know the pipeline is sound. The four-seam fastball is the workhorse at 52.6% usage and a blistering 96.6 mph average. The slider is the clear second pitch at 20.8%, then a knuckle curve at 12.3%. Look at the spin column for the real scouting nugget: the knuckle curve spins at 2784 rpm - the highest in the arsenal - while the changeup, at 1577 rpm, spins far slower by design, because a changeup wants to kill spin to drop and fade. That lone sinker (2 pitches, 0.1%) is almost certainly a misclassified fastball or two, a good reminder that pitch tagging isn't perfect.
-
Draw the mix as a chart
A horizontal bar chart reads like a scouting sheet - longest bar is the most-used pitch. We sort ascending so matplotlib stacks the primary pitch on top, color the bars baseball red, and then label each bar with its average velocity so the chart carries two facts at once: how often and how hard.
python plot_df = mix.sort_values("usage%") fig, ax = plt.subplots(figsize=(8, 4.8)) bars = ax.barh(plot_df.index, plot_df["usage%"], color="#B23A3A") for bar, velo in zip(bars, plot_df["avg_velo"]): ax.text(bar.get_width() + 0.6, bar.get_y() + bar.get_height() / 2, f"{velo:.1f} mph", va="center", fontsize=9, color="#4A4F58") ax.set_xlabel("usage (% of pitches)") ax.set_title(f"{pitcher}'s pitch mix and velocity, 2023") ax.margins(x=0.16) fig.savefig("pitch_mix.png", dpi=144, bbox_inches="tight")Data: Baseball Savant via pybaseball, retrieved June 2026 The clever part is the
zip(bars, plot_df["avg_velo"])loop: it walks the bar objects and the velocity values together, andbar.get_width()plusbar.get_y()give us the exact pixel where the bar ends so we can drop the velocity label just past its tip. Callingax.margins(x=0.16)adds breathing room on the right so those labels don't run off the edge of the plot.
Troubleshooting
How do I find a different pitcher's ID?
Use the forward lookup: pyb.playerid_lookup("cole", "gerrit") returns a small table with a key_mlbam column - that number is the ID to plug into PITCHER_ID. Pass last name first, then first name. If a name is common you'll get several rows; the mlb_played_last column helps you pick the active player.
The first pull is slow or shows a progress bar
That's normal on the first run - statcast_pitcher is fetching a full season from Savant. Because we called pyb.cache.enable(), the second run reads from your disk and is nearly instant. Give the first one 20-30 seconds before worrying.
KeyError: 'release_spin_rate'
Statcast's column names occasionally drift between pybaseball versions. Print pitches.columns.tolist() and look for the spin column - it has been release_spin_rate for years, but if it's missing you can drop avg_spin from the agg and still build a perfectly good usage-and-velocity report.
A pitch type I don't expect shows up with a tiny count
That single sinker in our table is the classic example. Statcast's automatic pitch classifier mislabels a handful of pitches every season. If the noise bothers you, filter the table to pitches thrown at least, say, 1% of the time with mix.query("`usage%` >= 1") before charting.
Challenge yourself
Profile two aces side by side. Wrap the whole pull-and-group routine in a function that takes a pitcher ID and returns the mix table, then call it for Cole and a contrast pitcher like a sinkerballer (try Logan Webb, ID 657277). Put their usage bars on the same chart - or print both arsenals - and the difference in shape jumps out: a four-seam-and-slider power profile versus a sinker-heavy ground-ball profile. For a tougher extension, add a fifth column for each pitch's whiff rate by counting rows where description contains "swinging_strike" and dividing by swings. Now you can see not just what he throws, but what actually misses bats.
Get the code
Here's the complete, working script for this tutorial. It runs exactly as shown.
Download the finished script (24_profile_a_pitcher_pitch_mix_and_velocity.py)This script imports a small shared helper (and reads any bundled sample data) that live next to it in /downloads/ — grab these into the same folder so it runs as-is: sdt_common.py. Or skip the collecting: the Baseball Analytics with Statcast bundle has this whole course’s scripts and data in one ZIP.