Track a Team's Form: Rolling Goal Differential
Part 3 of 4 in Hockey & Cross-League Projects · course bundle (code + data)
What you'll build
A team's game-by-game form as a rolling goal differential line.
"Form" is the word fans use for a team that's hot or cold right now — and it turns out you can compute it, not just feel it. Pull an entire NHL season of one team's games with scores, then smooth their goal differential over a rolling ten-game window, and a jagged game-by-game line resolves into a readable wave of momentum. We'll do it with the Edmonton Oilers and the NHL's free public API; the payoff is a chart where every hot streak and slump is visible at a glance.
This builds on your first NHL data pull, so you already know how to open a polite session and read JSON from api-web.nhle.com. The new idea is the rolling window - one of the most useful moves in all of time-series analysis. The data comes from the NHL public API (api-web.nhle.com), retrieved June 2026.
-
Pull the full season schedule
The NHL exposes a whole team's season at one endpoint:
club-schedule-season/<TEAM>/<SEASON>. We open a polite session - the same well-mannered HTTP wrapper from the intro tutorial, with browser headers and automatic retries - and request Edmonton's 2024-2025 season. The team code is the three-letter abbreviationEDM, and the season is the two years stuck together as20242025.python import matplotlib.pyplot as plt import pandas as pd TEAM, SEASON = "EDM", "20242025" session = sdt.polite_session(referer="https://www.nhl.com/") sched = session.get( f"https://api-web.nhle.com/v1/club-schedule-season/{TEAM}/{SEASON}", timeout=30).json()The response's
"games"key holds a list of game objects, one per fixture - preseason, regular season, and any that haven't been played yet. Each one carries ahomeTeamand anawayTeamobject with scores once the game is final. Our job is to walk that list and pull out, for every completed game, how many goals Edmonton scored and conceded. -
Walk the games and record goals for and against
We loop over the games and keep only finished ones - the API marks those with a
gameStateof"OFF"or"FINAL". We also keep only regular-season games: NHL game ids encode the type in digits 5-6, where"02"means regular season (preseason is"01", playoffs"03"), so we skip the exhibitions that would otherwise pollute our form line. For each remaining game we figure out which side is Edmonton: if the home team's abbreviation is ourTEAM, then "us" is the home object and "them" is away; otherwise it's the other way around. Then we record the date, our goals (gf), and their goals (ga). A guard skips any game that somehow has no score.python rows = [] for g in sched["games"]: if g.get("gameState") not in ("OFF", "FINAL"): continue if str(g["id"])[4:6] != "02": # regular season only continue home, away = g["homeTeam"], g["awayTeam"] us, them = (home, away) if home["abbrev"] == TEAM else (away, home) if us.get("score") is None or them.get("score") is None: continue rows.append({"date": g["gameDate"], "gf": us["score"], "ga": them["score"]})That home-or-away swap is the crux of the whole script. Goal differential only means something from one team's point of view, so we always orient "goals for" and "goals against" to Edmonton no matter which side of the fixture they were on. Using
.get(...)instead of[...]for the optional fields returnsNonerather than raising aKeyErrorwhen a key is absent - a small habit that makes messy real-world JSON safe to walk. -
Build the game log and the rolling average
We turn the list of dictionaries into a DataFrame, sort it by date so the games are in chronological order, and reset the index so it reads as a clean count. Then come the three columns that matter: a
gamenumber 1..N, the per-gamediff(goals for minus goals against), and the star of the show -roll10, the average ofdiffover the last ten games.python gl = pd.DataFrame(rows).sort_values("date").reset_index(drop=True) gl["game"] = range(1, len(gl) + 1) gl["diff"] = gl["gf"] - gl["ga"] gl["roll10"] = gl["diff"].rolling(10).mean()rolling(10)creates a sliding window ten games wide;.mean()averages the differential inside it, then the window slides forward one game and does it again. A single game's differential is noisy - a 6-1 win and a 1-2 loss swing wildly - but averaged over ten, the line settles into the team's true recent form. This is exactly the smoothing technique behind every "last 10 games" stat you've ever seen on a broadcast. -
Look at the game log
Let's print the season's size and the first few rows so we can see the columns line up.
python print(f"{TEAM}, {SEASON[:4]}-{SEASON[4:]}: {len(gl)} games") sdt.show_df(gl[["game", "date", "gf", "ga", "diff", "roll10"]], n=6)Edmonton's game log (first rows)EDM, 2024-2025: 82 games game date gf ga diff roll10 0 1 2024-10-09 0 6 -6 NaN 1 2 2024-10-12 2 5 -3 NaN 2 3 2024-10-13 1 4 -3 NaN 3 4 2024-10-15 4 3 1 NaN 4 5 2024-10-17 4 2 2 NaN 5 6 2024-10-19 1 4 -3 NaN
This is the most important thing to understand about a rolling window, and the output shows it plainly:
roll10isNaNfor the first several games. That's not a bug - a ten-game average simply doesn't exist until ten games have been played, so pandas fills those early rows with "not a number" and the real averages begin at game 10. The raw per-gamediffcolumn already tells a story of an ugly start: Edmonton open with a 6-0 drubbing (diff -6) and lose three of their first four, before a pair of wins (4-3 and 4-2) briefly steadies things. That early volatility is exactly why we smooth - and why the rolling line won't even start until enough games have stacked up. The header also confirms the pull caught the full regular season of 82 games. -
Chart the form as a filled wave
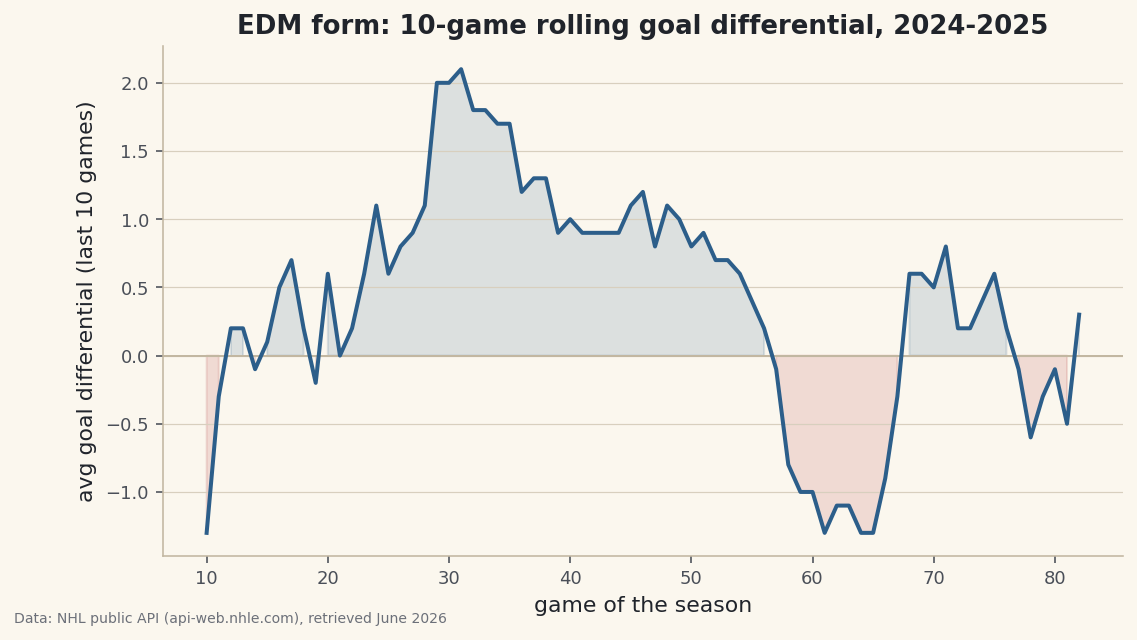
Now we draw the rolling line so the streaks read instantly. We add a horizontal line at zero - the break-even point where a team scores exactly as many as it allows - then plot
roll10against the game number. The flourish that makes it pop isfill_between: we shade the area above zero in hockey blue (good form) and below zero in red (bad form), each only where the line is on that side, using thewhere=argument.python fig, ax = plt.subplots(figsize=(8.6, 4.6)) ax.axhline(0, color="#C2B7A1", linewidth=1) ax.plot(gl["game"], gl["roll10"], color="#2C5E8A", linewidth=2) ax.fill_between(gl["game"], gl["roll10"], 0, where=gl["roll10"] >= 0, color="#2C5E8A", alpha=0.15) ax.fill_between(gl["game"], gl["roll10"], 0, where=gl["roll10"] < 0, color="#B23A3A", alpha=0.15) ax.set_title(f"{TEAM} form: 10-game rolling goal differential, " f"{SEASON[:4]}-{SEASON[4:]}") ax.set_xlabel("game of the season") ax.set_ylabel("avg goal differential (last 10 games)") fig.savefig("rolling_goal_diff.png", dpi=144, bbox_inches="tight")Data: NHL public API (api-web.nhle.com), retrieved June 2026 The zero line is the spine of the chart: every stretch where the blue wave rides above it is a run where Edmonton outscored opponents over their last ten, and every dip into red is a cold spell. Notice the line is blank for the first nine games before the rolling average kicks in - the visual echo of those
NaNvalues we just discussed. Read left to right and you're reading the season's momentum: the peaks are the hot streaks, the troughs are the slumps, and the height of each tells you how dominant or dire the team was at that moment. The source credit for the NHL public API rides along in the figure footer automatically.
Troubleshooting
The roll10 column is all NaN or mostly empty
The first nine values being NaN is correct - a ten-game window needs ten games first. But if every value is NaN, you have fewer than ten completed games (an early-season or offseason pull), or the rows didn't sort by date. Confirm len(gl) is comfortably above ten and that sort_values("date") ran before the rolling call.
KeyError: 'games' from the response
The endpoint or season string is off. Make sure the URL is exactly /v1/club-schedule-season/EDM/20242025 - the season is two four-digit years concatenated, with no dash. A wrong team code or a season the API doesn't have yet returns a different shape with no "games" key.
Goal differential looks backwards (good team trends negative)
The home/away orientation is flipped. The line us, them = (home, away) if home["abbrev"] == TEAM else (away, home) must put your team into us. If you hard-coded us = home, then every away game counts the opponent's goals as yours. Print a couple of rows and sanity-check a game you remember.
The request hangs or times out
We pass timeout=30 so a request can't hang forever, and the polite session retries flaky status codes with backoff. If it still fails you may be offline or rate-limited - wait a moment and re-run rather than firing repeated requests by hand.
Challenge yourself
Change the window: try rolling(5) for a twitchier line that reacts to short hot streaks, and rolling(20) for a calmer one that shows only the big seasonal trends - the right window is a judgement call, and seeing them side by side teaches you the trade-off. Then overlay a second team: pull another club code (say COL for Colorado) the same way and plot both rolling lines on one axis to compare their seasons' shapes. For a finishing touch, extend the id filter to include the playoffs (game type "03") and mark where the regular season ends with a vertical line, so a single chart shows a team's form carrying into the postseason.
Get the code
Want it all in one file? This is the exact script that produced the outputs above.
Download the finished script (36_track_a_team_form_rolling_goal_differential.py)This script imports a small shared helper (and reads any bundled sample data) that live next to it in /downloads/ — grab these into the same folder so it runs as-is: sdt_common.py. Or skip the collecting: the Hockey & Cross-League Projects bundle has this whole course’s scripts and data in one ZIP.