Build a Standings Table from a Season of Game Results
Part 10 of 10 in Python Foundations for Sports Data · course bundle (code + data)
What you'll build
A full W-L standings table aggregated from a game-by-game results log.
The standings are an output, not an input. Underneath every win-loss table is a long, plain log of individual games — who played whom and who scored what — and turning that log into a standings table is one of the most common things you'll do with sports data. Take a full season of game results and you can collapse it into wins, losses, and win percentage with a single groupby. But there's a small reshape in front of that groupby that most beginners miss — every game row touches two teams — and once you see how to handle it you'll reach for the move everywhere.
This builds on Group, Pivot, Reshape. The data is the bundled nba_home_results.csv — a real season of game results (date, home/away team, and each side's points), retrieved from Basketball-Reference — so it runs offline.
-
Look at the game log
Each row is one game and touches two teams — one home, one away. That's the wrinkle: to count a team's results we need to see it whether it was home or away.
python import pandas as pd games = pd.read_csv("nba_home_results.csv") # columns: date, away_team, away_pts, home_team, home_ptsIf we only ever looked at the
home_teamcolumn we'd capture half of each team's season and miss the other half. So first we reshape. -
One row per team, per game
We build the log twice — once from the home team's point of view, once from the away team's — renaming each side's points to neutral
pf(points for) andpa(points against). Stack them and every team now has one row for every game it played.python home = games.rename(columns={"home_team": "team", "home_pts": "pf", "away_pts": "pa"})[["team", "pf", "pa"]] away = games.rename(columns={"away_team": "team", "away_pts": "pf", "home_pts": "pa"})[["team", "pf", "pa"]] long = pd.concat([home, away], ignore_index=True) long["win"] = (long["pf"] > long["pa"]).astype(int)The
wincolumn is a boolean (pf > pa) turned into 1 or 0 with.astype(int)— which makes the next step trivial, because summing a column of 1s and 0s just counts the wins. -
One groupby builds the table
Group by team, sum the wins, count the games, and the standings fall out.
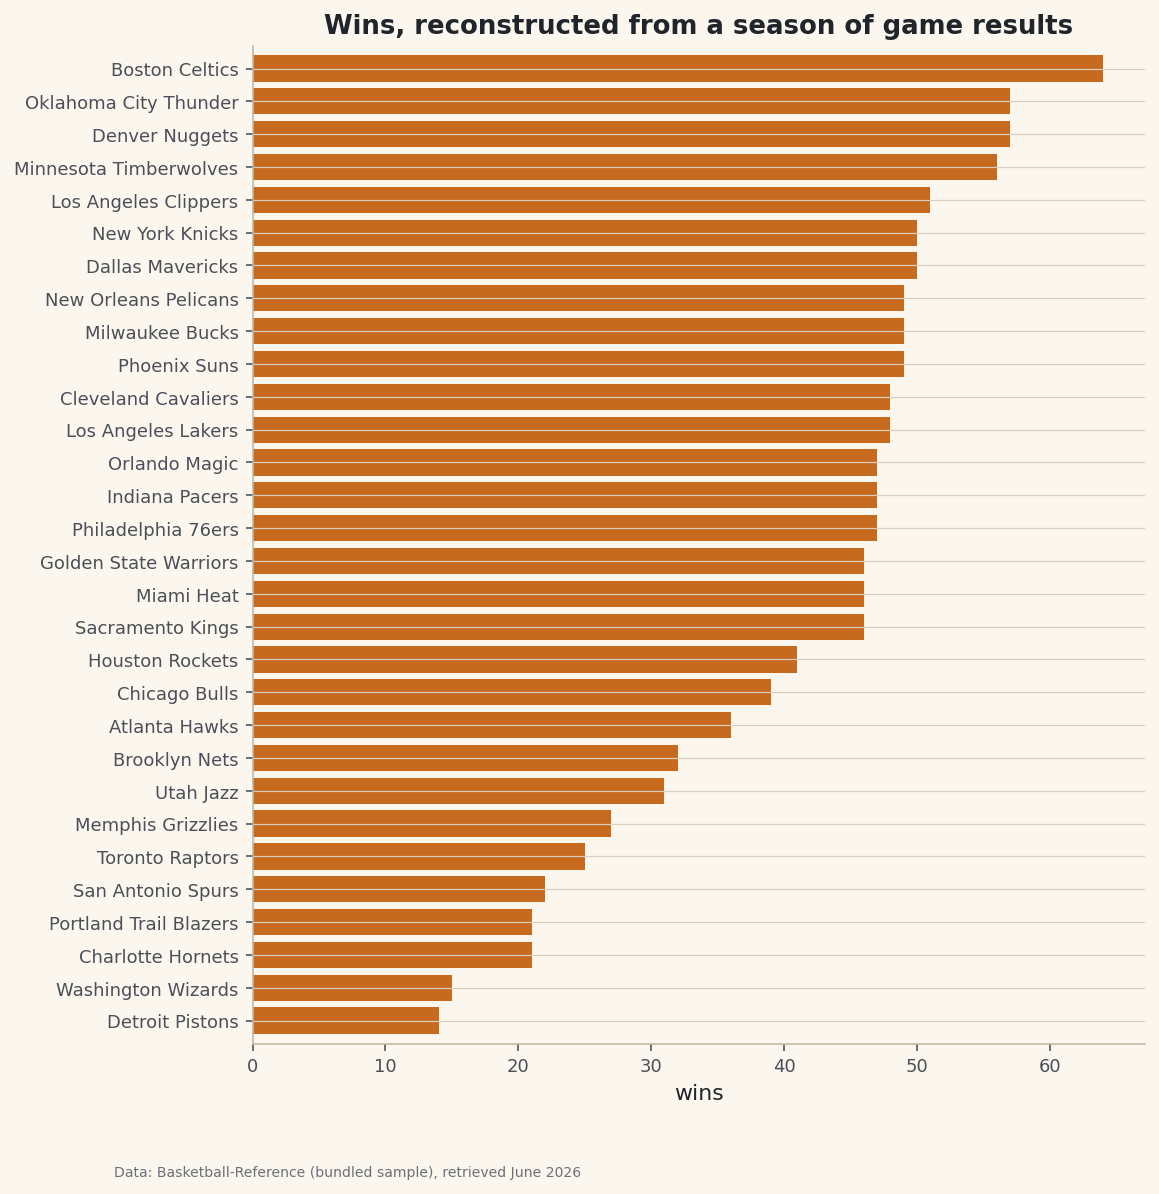
python standings = (long.groupby("team") .agg(W=("win", "sum"), G=("win", "count")) .reset_index()) standings["L"] = standings["G"] - standings["W"] standings["WinPct"] = (standings["W"] / standings["G"]).round(3) standings = standings.sort_values("W", ascending=False) print(standings[["team", "W", "L", "WinPct"]].head(8).to_string())Standings, rebuilt from the game logReconstructed standings from 1231 games: team W L WinPct 1 Boston Celtics 64 18 0.780 7 Denver Nuggets 57 25 0.695 20 Oklahoma City Thunder 57 25 0.695 17 Minnesota Timberwolves 56 26 0.683 12 Los Angeles Clippers 51 31 0.622 6 Dallas Mavericks 50 32 0.610 19 New York Knicks 50 32 0.610 16 Milwaukee Bucks 49 33 0.598From a flat list of more than a thousand games, two lines produced the league table — the Celtics on top at 64–18 (.780), with Denver and Oklahoma City tied behind them. No game was counted twice and none was missed, because the home-and-away reshape gave every team a complete season.
-
Chart the standings
python import matplotlib.pyplot as plt ordered = standings.sort_values("W") # ascending so the best record lands on top fig, ax = plt.subplots(figsize=(8, 9)) ax.barh(ordered["team"], ordered["W"]) ax.set_xlabel("wins") fig.savefig("wins_bar.png", dpi=144, bbox_inches="tight")Data: Bundled sample (NBA game results), retrieved June 2026 The same standings, now ranked at a glance. Everything in this chart was computed from raw scores — we never needed a pre-made standings table at all.
Troubleshooting
Every team's win total is about half what it should be
You aggregated only the home (or only the away) rows. Each team plays home and away, so you must build both perspectives and concat them before grouping — that's the whole point of the reshape step.
Some team names appear twice in the standings
The same franchise is spelled inconsistently in the log (an abbreviation in some rows, a full name in others, or a stray space). groupby treats those as different teams. Standardize the names first — see Cleaning Messy Sports Data.
What about tie games?
Basketball has no ties, so pf > pa is safe here. In a sport that allows draws (soccer, hockey regulation), add a third case — e.g., assign 1/0/0.5 or count wins, draws, and losses separately — rather than forcing every game into win-or-loss.
Challenge yourself
Extend the aggregation to add points for and against: in the same .agg, sum pf and pa, then compute a points differential column and sort by it. Does the differential order match the win order? Then split the season into home and away records (group by team and by whether the row came from the home frame) to see who was a genuine road warrior.
Take the script home
The complete script below is the one that was actually run for this tutorial; download it and run it yourself.
Download the finished script (45_build_a_standings_table_from_results.py)This script imports a small shared helper (and reads any bundled sample data) that live next to it in /downloads/ — grab these into the same folder so it runs as-is: sdt_common.py, sdt_nba.py. Or skip the collecting: the Python Foundations for Sports Data bundle has this whole course’s scripts and data in one ZIP.


