Cleaning Messy Sports Data: Real-World Fixes for Real-World Files
Part 9 of 10 in Python Foundations for Sports Data · course bundle (code + data)
What you'll build
A tidy, correctly-typed DataFrame rescued from a deliberately messy CSV.
Nobody puts this on a course syllabus, and it's where you'll spend half your time: cleaning data. The polished tutorials hand you a perfect file and skip straight to the fun part. Real files don't cooperate. A scraped table, a copied spreadsheet, an export from some ancient system - they show up with stray spaces, percent signs glued to numbers, thousands separators, blank cells, and a duplicated row or two hiding in the middle. Learn to fix that calmly and you can work with almost any data. Skip it and your beautiful analysis quietly runs on garbage.
So we're going to take a deliberately messy file - messy_team_stats.csv, real 2023 MLB numbers from the MLB Stats API that I roughed up on purpose to look like the exports you'll actually meet - and walk it from unusable text to a tidy, correctly-typed table. One defect at a time, and I'll prove each fix rather than trusting it. The discipline I want you to steal from this is the order: diagnose first, fix second, verify third. Guessing at fixes blindly is exactly how clean data turns into wrong data without anyone noticing. It builds on the pandas basics - selecting, the .dtypes check, a little string work.
-
Diagnose the damage
Before changing anything, we look. The fastest tell is the combination of column names and dtypes. We load the file and print both.
python import pandas as pd raw = pd.read_csv("messy_team_stats.csv") print("Raw columns:", list(raw.columns)) print() print(raw.dtypes)The columns are a messRaw columns: ['team ', ' league', ' win_pct ', ' runs_scored ', ' runs_allowed ', ' games'] team str league str win_pct str runs_scored int64 runs_allowed float64 games int64 dtype: object
Two problems jump out. First, the column names carry leading and trailing spaces —
'team ',' league',' win_pct '— which means typingraw["team"]would raise aKeyErrorbecause the real name has a trailing space. Second,win_pctcame in asstr(text), not a number, so you can't average or plot it yet. Now let's look at the actual values.python print(raw.head(5).to_string())The values are dirty tooteam league win_pct runs_scored runs_allowed games 0 BRAVES NL 64.2% 947 716.0 162 1 Orioles AL 62.3% 807 678.0 162 2 Dodgers NL 61.7% 906 699.0 162 3 Rays AL 61.1% 860 NaN 162 4 Brewers NL 56.8% 728 647.0 162
The rot is everywhere: team names like
BRAVESin all caps and others (ASTROS) padded with spaces, win percentages written as64.2%, and aNaNsitting where the Rays' runs-allowed value should be. There's also a duplicate Braves row hiding at the bottom of the file, which we'll catch shortly. None of this is fatal — it's just a checklist. -
Fix the column names
We tackle the headers first, because every later fix references a column by name. Stripping whitespace from all of them at once is a one-liner:
.str.strip()applied toraw.columnstrims each name. Then we make a working copy so our edits clearly belong to a clean table.python raw.columns = raw.columns.str.strip() df = raw.copy()From here on,
df["team"],df["win_pct"], and the rest all resolve cleanly — no invisible spaces to trip over. -
Normalize the text and parse the percent
Next the team names. We chain two string operations:
.str.strip()removes the padding spaces, and.str.title()fixes the capitalization soBRAVESandASTROSbecomeBravesandAstros— consistent casing matters the moment you try to group or join on team name.python df["team"] = df["team"].str.strip().str.title()Now the percent column. A value like
"64.2%"is text because of that trailing%. We strip the sign, convert the remaining text to a real number with.astype(float), then divide by 100 so it becomes a proper proportion like0.642.python df["win_pct"] = df["win_pct"].str.replace("%", "", regex=False).astype(float) / 100The order is deliberate: you must remove every non-numeric character before
astype(float), or the conversion throws aValueErroron the stray symbol. -
Handle thousands separators and the missing value
If a runs column had arrived as text like
"1,247", the comma would block conversion, so the robust habit is to strip commas before casting to a number. We do that defensively here even though this sample's runs are small.python df["runs_scored"] = df["runs_scored"].astype(str).str.replace(",", "", regex=False).astype(int)The blank cell is more interesting, because you have to decide what to do with missing data rather than just reformat it. First we make the column reliably numeric with
pd.to_numeric(..., errors="coerce"), which turns any unparseable cell intoNaNinstead of crashing. Then we count the gaps and fill them — here with the column's median, a safe, outlier-resistant stand-in.python df["runs_allowed"] = pd.to_numeric(df["runs_allowed"], errors="coerce") missing = int(df["runs_allowed"].isna().sum()) df["runs_allowed"] = df["runs_allowed"].fillna(df["runs_allowed"].median())Filling is a judgment call, not a default. The median is reasonable here, but in other situations you might drop the row, carry the previous value forward, or leave the gap explicit — what matters is choosing deliberately and being able to say how many values you touched.
-
Drop the duplicate row
That repeated Braves line would double-count a team in any total or average.
drop_duplicatesremoves exact repeats; we count how many vanished and reset the index so the rows renumber cleanly from zero.python before = len(df) df = df.drop_duplicates().reset_index(drop=True) removed = before - len(df)Measuring the row count before and after is the cheap, honest way to confirm the operation did what you think — never assume; count.
-
Prove the fix
A cleaning job isn't done until you can demonstrate it worked. We report what we changed and re-check the dtypes — the same diagnostic we ran at the start, now expecting clean results.
python print(f"Filled {missing} missing runs_allowed value(s) with the median.") print(f"Dropped {removed} duplicate row(s).") print() print(df.dtypes)What changed, and the new typesFilled 1 missing runs_allowed value(s) with the median. Dropped 1 duplicate row(s). team str league str win_pct float64 runs_scored int64 runs_allowed float64 games int64 dtype: object
One missing value filled, one duplicate removed, and every column now carries a sensible type:
teamandleaguearestr,win_pctandruns_allowedarefloat64, andruns_scoredisint64. Crucially,win_pctis no longer text. Here's the cleaned table itself.python print(df.head(5).to_string())The cleaned tableteam league win_pct runs_scored runs_allowed games 0 Braves NL 0.642 947 716.0 162 1 Orioles AL 0.623 807 678.0 162 2 Dodgers NL 0.617 906 699.0 162 3 Rays AL 0.611 860 721.0 162 4 Brewers NL 0.568 728 647.0 162
Compare this to the raw printout from step one:
Bravesis title-cased,0.642is a real number, and the Rays' once-blank runs-allowed now reads721.0— the median fill we computed. The data went from unusable to analysis-ready. -
Confirm it with a chart
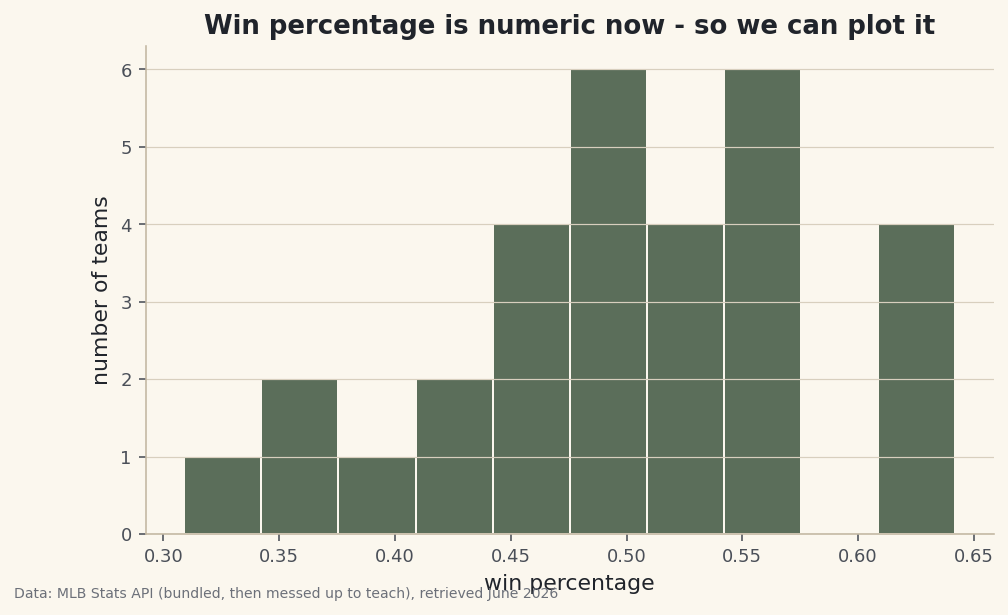
Here's the real test of whether
win_pctis genuinely numeric: try to plot it. A histogram simply cannot be drawn from text, so if this renders, the column is truly fixed. We bin the win percentages into ten buckets to see how the league's records were distributed.python import matplotlib.pyplot as plt fig, ax = plt.subplots(figsize=(7.6, 4.4)) ax.hist(df["win_pct"], bins=10, edgecolor="#FBF7EE") ax.set_title("Win percentage is numeric now - so we can plot it") ax.set_xlabel("win percentage") ax.set_ylabel("number of teams") fig.savefig("cleaned_distribution.png", dpi=144, bbox_inches="tight")Data: Bundled sample (deliberately messy team stats), retrieved June 2026 The bars cluster in the middle near .500 and thin out toward the extremes — the familiar shape of a league where most teams finish somewhere around average. That the chart drew at all is the final proof: a column that was useless text a few steps ago now behaves like the number it always should have been.
Troubleshooting
KeyError: 'team' right after loading the file
The real column name has hidden whitespace — it's 'team ', not 'team'. Print list(df.columns) to see the exact names, then run df.columns = df.columns.str.strip() before referencing any column. This is always the first fix on a messy file.
ValueError: could not convert string to float: '64.2%'
astype(float) hit a character it can't parse. Remove every non-numeric symbol first — the % here, commas elsewhere — with .str.replace(...), and only then convert. The cleaning order matters: strip, then cast.
A whole numeric column is still str (object) after cleaning
One bad cell is forcing the entire column to text. Use pd.to_numeric(df["col"], errors="coerce"), which converts what it can and turns the rest into NaN instead of failing. Then count the NaNs with .isna().sum() and decide how to fill or drop them.
drop_duplicates removed nothing (or too much)
By default it only drops rows that match on every column, so a near-duplicate with one differing cell survives. If you mean "same team," pass a subset: df.drop_duplicates(subset=["team"]). Conversely, if it removed legitimate rows, your duplicate definition is too loose — narrow the subset.
Challenge yourself
Wrap the whole pipeline into a single function, clean_team_stats(path), that reads any similarly messy file and returns a tidy DataFrame. Then make it resilient: instead of assuming exactly one blank cell, have it report how many it filled per column, and add a check that warns if any column is still non-numeric after cleaning. A reusable, self-reporting cleaner is the difference between fixing one file and fixing every file like it.
The finished script
Everything this tutorial built, assembled in one runnable file.
Download the finished script (04_cleaning_messy_sports_data.py)This script imports a small shared helper (and reads any bundled sample data) that live next to it in /downloads/ — grab these into the same folder so it runs as-is: sdt_common.py, messy_team_stats.csv. Or skip the collecting: the Python Foundations for Sports Data bundle has this whole course’s scripts and data in one ZIP.


