Merging and Joining Two Datasets with pandas
Part 7 of 10 in Python Foundations for Sports Data · course bundle (code + data)
What you'll build
Two separate tables joined on a shared key into one, then charted.
A team's win-loss record comes from a standings feed. Its runs scored and allowed might come from a different endpoint. Salaries, attendance, and advanced stats each live somewhere else again. Real sports data almost never arrives in one tidy table, and the skill that stitches the pieces together — the join, which pandas spells merge — is the most useful move I know after loading a CSV. So I'll take two separate tables, join them on a shared key, and then build a chart from a column that existed in neither one alone.
This builds on Pandas for Sports Data. To keep it offline and concrete, we'll split the bundled sample_standings.csv (real 2023 MLB standings) into two tables and join them back — exactly the shape of the real problem, where wins and runs come from different places.
-
Two tables, one shared key
Imagine these came from two sources: a record feed with wins and losses, and a scoring feed with runs. Both identify teams by name — that shared
Teamcolumn is the key we'll join on.python import pandas as pd full = pd.read_csv("sample_standings.csv") record = full[["Team", "Abbr", "W", "L"]] # pretend: from a standings feed scoring = full[["Team", "RS", "RA"]] # pretend: from a scoring feedA join only works when both tables share a column whose values line up. Here it's the team name; in the wild it might be a team ID, a player ID, or a date.
-
Merge on the key
mergematches rows whose key agrees and glues their columns together. Thehowargument decides what to do with rows that don't match:"inner"(the default) keeps only teams in both tables;"left"keeps every row of the left table;"outer"keeps everything.python merged = record.merge(scoring, on="Team", how="inner") merged["RunDiff"] = merged["RS"] - merged["RA"] print(merged.sort_values("RunDiff", ascending=False).head().to_string())Two source tables, then the joined resultrecord table (one source): Team Abbr W L 0 Braves ATL 104 58 1 Orioles BAL 101 61 2 Dodgers LAD 100 62 scoring table (another source): Team RS RA 0 Braves 947 716 1 Orioles 807 678 2 Dodgers 906 699 merged on 'Team', with a computed RunDiff: Team W RS RA RunDiff 0 Braves 104 947 716 231 2 Dodgers 100 906 699 207 3 Rays 99 860 665 195 7 Rangers 90 881 716 165 5 Astros 90 827 698 129That last column is the whole point:
RunDiffneededRSandRAfrom the scoring table sitting next to a row we could read — something neither table could give us alone. The 2023 Braves top the joined table at +231, the Dodgers next at +207. -
Chart the joined data
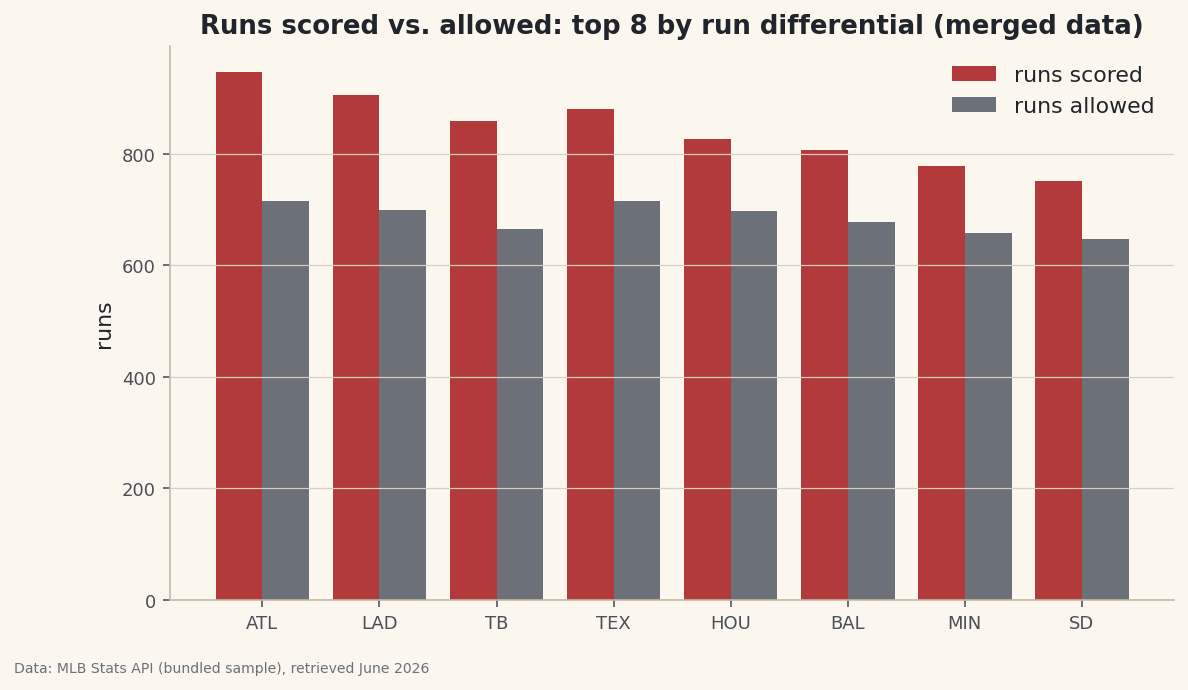
With both feeds in one frame, a grouped bar chart puts runs scored and allowed side by side for the best run-differential teams.
python import numpy as np import matplotlib.pyplot as plt top = merged.sort_values("RunDiff", ascending=False).head(8) x = np.arange(len(top)); w = 0.4 fig, ax = plt.subplots(figsize=(9, 5)) ax.bar(x - w/2, top["RS"], w, label="runs scored") ax.bar(x + w/2, top["RA"], w, label="runs allowed") ax.set_xticks(x); ax.set_xticklabels(top["Abbr"]); ax.legend() fig.savefig("merged_bars.png", dpi=144, bbox_inches="tight")Data: Bundled sample (2023 MLB standings), retrieved June 2026 Every one of these teams shows a taller "scored" bar than "allowed" bar — which is exactly what a positive run differential means, now visible at a glance because the join let us draw both series together.
Troubleshooting
The merged table is missing rows I expected
An inner join drops any key that isn't in both tables. If one feed spells a team differently ("St. Louis" vs "St Louis") the keys don't match and those rows vanish. Inspect the keys on both sides, standardize spelling first, or use how="left" and look for the resulting NaNs to see exactly what failed to match.
I get columns named RS_x and RS_y
Both tables had a column with the same name (other than the key), so pandas disambiguated them with suffixes. Either drop the duplicate before merging, or pass suffixes=("_record", "_scoring") to label them meaningfully.
Rows multiplied after the merge
The key wasn't unique on one side, so every match was paired with every duplicate (a many-to-many join). Check with df["Team"].duplicated().any() and de-duplicate, or pass validate="one_to_one" to make pandas raise instead of silently exploding the row count.
Challenge yourself
Make a third tiny table by hand — say a DataFrame of just a few teams' division titles — and left-merge it onto merged. Watch how teams without a row in your small table get NaN, and how an inner join would have dropped them instead. Then try how="outer" and count the rows to prove to yourself which join keeps the most.
Take the script home
The complete script below is the one that was actually run for this tutorial; download it and run it yourself.
Download the finished script (44_merge_and_join_datasets_with_pandas.py)This script imports a small shared helper (and reads any bundled sample data) that live next to it in /downloads/ — grab these into the same folder so it runs as-is: sdt_common.py. Or skip the collecting: the Python Foundations for Sports Data bundle has this whole course’s scripts and data in one ZIP.


