Build an Elo Rating System from Scratch
What you'll build
An Elo rating system built in ~20 lines over a real 2023-24 NBA season, with a rating-progression chart and the final-standings ranking it discovers on its own.
Here's something that should feel a little like magic: hand a computer nothing but a list of who-beat-whom, never tell it which teams are good, and it will rank them correctly anyway. The trick is Elo — the rating system invented for chess and now running quietly under FiveThirtyEight's sports models, the international football rankings, and your video-game matchmaking. It's about twenty lines of Python, and once you've built one you'll never look at a "power ranking" the same way.
This builds on Your First Sports Data Visualization and pairs well with Monte Carlo season simulation. The data is the bundled nba_home_results.csv (real 2023-24 NBA results), so it runs offline.
-
The whole idea in one sentence
Every team starts at the same rating — 1500 by convention. Before a game, the ratings predict a win probability. After the game, the winner takes points from the loser: a lot if the result was a surprise, a little if it was expected. That's it. The system is a closed economy — points only move between the two teams — so the league average never drifts from 1500.
The prediction uses the logistic curve, the same S-shape behind most win-probability models. The gap in ratings (plus a bonus for the home side) becomes a probability:
python def expected(r_home, r_away, home_adv=100): # probability the home team wins, from the rating gap return 1 / (1 + 10 ** ((r_away - (r_home + home_adv)) / 400))The 400 is a scale constant from chess: a 400-point edge means you're expected to win about 91% of the time. The
home_advof 100 Elo points is roughly the documented NBA home-court edge, added to the home team's strength for the prediction only. -
Load the games — in date order
This is the one rule you cannot break: Elo must process games chronologically. A team's rating in March depends on every result before it, so shuffling the games scrambles the ratings.
python import pandas as pd games = pd.read_csv("nba_home_results.csv") games["date"] = pd.to_datetime(games["date"]) games = games.sort_values("date").reset_index(drop=True) # non-negotiable START, K = 1500.0, 20.0 rating = {t: START for t in pd.unique(games[["home_team", "away_team"]].values.ravel())}Kis the step size — how many points one game can move a rating. Bigger K reacts faster but is noisier; 20 is a sensible middle for a season. -
The update: move toward the surprise
For each game, compute the expectation, see what happened, and shift both ratings by
K × (actual − expected). The winner's gain is exactly the loser's loss.python for _, g in games.iterrows(): h, a = g["home_team"], g["away_team"] exp_h = expected(rating[h], rating[a]) home_won = 1.0 if g["home_pts"] > g["away_pts"] else 0.0 rating[h] += K * (home_won - exp_h) rating[a] -= K * (home_won - exp_h)Watch the first three games go by one at a time:
Rating the first three gamesFirst three games, rated one at a time: Denver Nuggets (1500) vs Los Angeles Lakers (1500): P(home win)=0.64, home won -> Denver Nuggets now 1507, Los Angeles Lakers now 1493 Golden State Warriors (1500) vs Phoenix Suns (1500): P(home win)=0.64, home lost -> Golden State Warriors now 1487, Phoenix Suns now 1513 Los Angeles Clippers (1500) vs Portland Trail Blazers (1500): P(home win)=0.64, home won -> Los Angeles Clippers now 1507, Portland Trail Blazers now 1493 Notice: an expected home win nudges ratings only a little; an upset (low P, away wins) moves them a lot. That's the K-step at work.
Look at the size of the moves. An expected home win shifts the ratings by about 7 points; the upset in game two — the home team was a 64% favorite and lost — moves them nearly twice as far. That asymmetry is the entire intelligence of the system: surprising results carry more information, so they count for more.
-
Run the season and read the standings it invented
After all 1,231 games, sort the ratings. We never told the model a single thing about team quality — only who beat whom — yet:
Season-end Elo, top and bottomFinal 2023-24 Elo ratings (top 6): Boston Celtics 1687 Oklahoma City Thunder 1641 Denver Nuggets 1638 Minnesota Timberwolves 1612 Dallas Mavericks 1608 Phoenix Suns 1607 Bottom 3: Portland Trail Blazers 1321 Detroit Pistons 1286 Washington Wizards 1272 Sum stays ~1500 x 30 = closed economy: points only move between teams.
That's the real 2023-24 NBA, recovered from results alone: the Celtics (the season's best record) on top, the Wizards and Pistons at the bottom. The ratings discovered the standings without ever seeing a win-loss column.
-
Did it actually predict anything?
A ranking is only useful if it forecasts. Check the simplest version: before each game, did the higher-rated team (home edge included) go on to win?
A sanity check on the ratingsIn-sample: the higher pre-game Elo (incl. home edge) picked the winner in 765 of 1231 games = 62.1%. That beats a coin flip because real teams differ - but it's in-sample, so treat it as a sanity check, not a forecast accuracy.
About 62% — comfortably better than a coin flip, which is what you'd hope for from a system this simple. The honest caveat is that this is in-sample: the ratings were built from these same games, so this is a sanity check, not a true out-of-sample accuracy. A real forecast test would freeze the ratings and predict the next season.
-
Picture the season
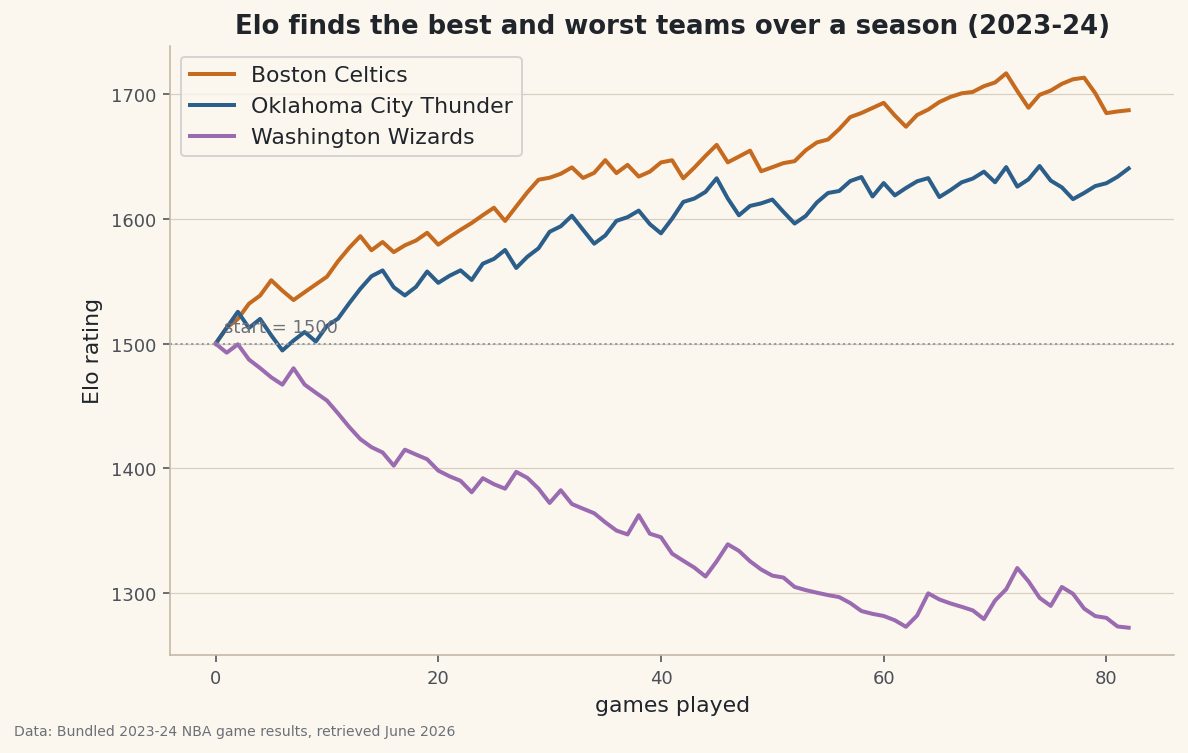
Plot a few teams' ratings game by game and the season becomes a story you can see — the contenders climbing away from 1500, the cellar team sliding down.
python import matplotlib.pyplot as plt history = {t: [START] for t in rating} # record before the loop, append inside it # ...append rating[h], rating[a] to history each game... fig, ax = plt.subplots(figsize=(9, 5.5)) for t in ["Boston Celtics", "Oklahoma City Thunder", "Washington Wizards"]: ax.plot(history[t], label=t) ax.axhline(1500, ls=":"); ax.legend() fig.savefig("elo_progression.png", dpi=144, bbox_inches="tight")Data: Bundled sample (real 2023-24 NBA game results), retrieved June 2026 And the full final ranking, every team relative to the 1500 average:
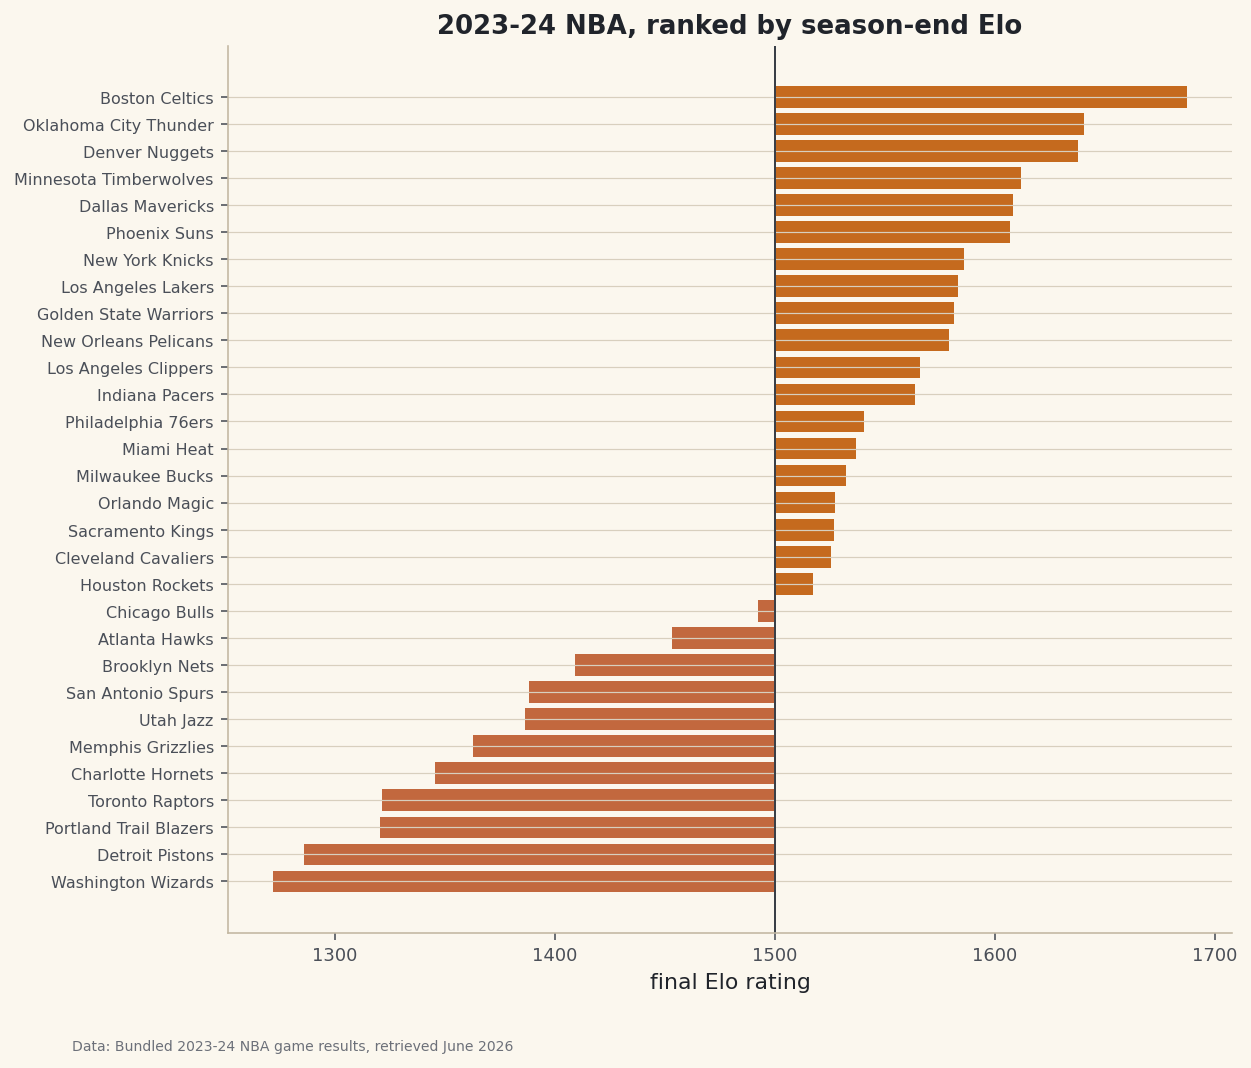
Data: Bundled sample (real 2023-24 NBA game results), retrieved June 2026
Troubleshooting
My ratings look random / wrong
Almost always the date sort. If you process games out of order, a team's rating reflects the wrong history. Confirm games.sort_values("date") ran and that your loop reads the sorted frame, not the original.
The ratings drift away from 1500 overall
They shouldn't — each update adds to one team exactly what it subtracts from the other, so the total is conserved. If the league mean moves, you're updating one side with a different value than the other (a sign error). The home team gets +K(actual − exp); the away team gets the negative of the same number.
What value of K should I use?
It's a trade-off. Small K (10) is stable but slow to react to a team that's genuinely improved; large K (40) reacts fast but whipsaws on noise. Tune it by checking out-of-sample prediction accuracy across a few values. Many real systems also shrink K once a team has a long history, or scale each update by margin of victory.
Challenge yourself
Make it predictive. Split the season in half: build ratings on the first half, freeze them, and measure how often they pick winners in the second half — that's an honest out-of-sample accuracy. Then add a margin-of-victory multiplier (a blowout should move ratings more than a one-point game) and see if your second-half accuracy improves. For a stiffer test, carry the final ratings forward and predict the opening weeks of the next season.
Get the code
Here's the complete, working script for this tutorial. It runs exactly as shown.
Download the finished script (65_build_an_elo_rating_system.py)This script imports a small shared helper (and reads any bundled sample data) that live next to it in /downloads/ — grab these into the same folder so it runs as-is: sdt_common.py, sdt_nba.py.


