The Chi-Square Test from Scratch: Is an NBA Floor Left-Right Symmetric?
Part 7 of 10 in Randomness, Inference & Simulation · course bundle (code + data)
What you'll build
A 2x2 contingency table (side of floor x shot outcome) from 25,000 real NBA shots via pd.crosstab, expected counts and the chi-square statistic computed by hand in numpy (no scipy), and the df=1 critical-value verdict - which lands at 0.005 against a 3.841 bar, a textbook fail-to-reject.
Basketball folklore says shooters have a favorite corner. Statistics has a better question: if side of the floor and shot outcome were completely unrelated, what would the counts look like — and how far from that do the real counts sit? That's the chi-square test for independence, and it's the single most useful test to know for categorical sports questions: side vs outcome, home vs result, starter vs bench production. We'll build it from scratch on 25,000 real NBA shots — contingency table with pd.crosstab, expected counts and the statistic by hand in numpy, no scipy required.
Further reading: Chi-Square Tests: Categorical Data Analysis, DataField.dev.
The punchline is worth knowing before you start, because it's the honest kind: the test comes back about as null as a result can be. The floor has no favorite side. Learning to accept that cleanly — instead of squinting for a pattern — is half the value of the method.
Step 1: from 25,000 shots to a 2×2 table
Each row in the bundled file is one shot with its ZONE_NAME (which encodes Left/Right/Center) and whether it went in. Center-line shots have no side, so we keep only the sided ones and cross-tabulate side against outcome:
df["side"] = np.where(df["ZONE_NAME"].str.contains("Left"), "Left",
             np.where(df["ZONE_NAME"].str.contains("Right"), "Right", "Center"))
sided = df[df["side"].isin(["Left", "Right"])].copy()
sided["outcome"] = np.where(sided["SHOT_MADE"].astype(str).str.lower().isin(["true", "1"]),
                            "Made", "Missed")
table = pd.crosstab(sided["side"], sided["outcome"])outcome Made Missed side Left 2063 3342 Right 2046 3305 sided shots: 10,756 of 25,000 total
10,756 sided shots split into four cells. Every chi-square test starts exactly here: real counts in a grid, one categorical variable per axis.
Step 2: what independence would predict
The null hypothesis is that side and outcome are unrelated — lefts and rights are drawn from the same make-rate. Under that assumption, each cell's expected count is (row total × column total) / grand total. That's the whole formula, and matrix multiplication computes all four cells at once:
observed = table.values.astype(float)
row_tot = observed.sum(axis=1, keepdims=True)
col_tot = observed.sum(axis=0, keepdims=True)
expected = row_tot @ col_tot / observed.sum()observed: [[2063 3342] [2046 3305]] expected under independence: [[2064.8 3340.2] [2044.2 3306.8]]
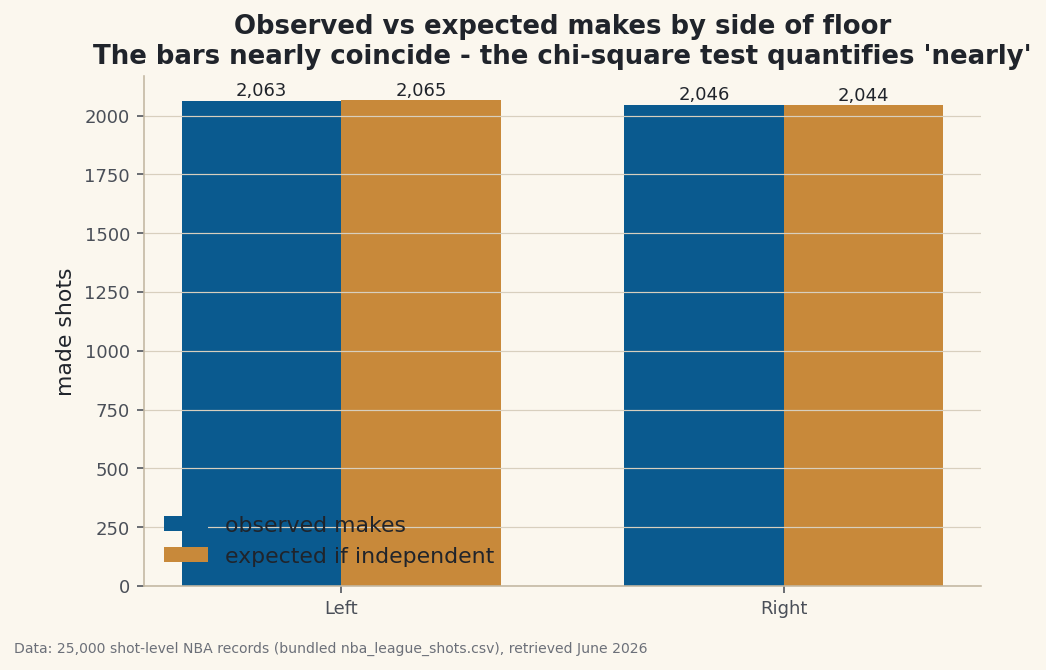
Look at how close observed and expected already are — the left side "should" have 2,064.8 makes under independence and actually has 2,063. The test is about to tell us that difference is nothing, but the eyeball got there first, and it's good practice to let it.
Step 3: the statistic and the verdict
The chi-square statistic sums (observed − expected)² / expected over the cells. Big values mean the real counts sit far from the independence prediction; the yardstick for "big" is the chi-square distribution with (rows−1)×(cols−1) degrees of freedom — here df = 1, where the 5% critical value is the number worth memorizing: 3.841.
chi2 = ((observed - expected) ** 2 / expected).sum()
dof = (observed.shape[0] - 1) * (observed.shape[1] - 1)
CRITICAL_05 = 3.841 # df=1, alpha=0.05chi-square statistic: 0.005 (df=1) critical value at alpha=0.05: 3.841 verdict: FAIL TO REJECT - no side effect detectable FG%: left 0.382, right 0.382
The statistic is 0.005 against a bar of 3.841 — not close, not ambiguous, not "trending toward significance." Both sides shoot 38.2%. If someone shuffled the side labels randomly, you'd see a gap this small or larger almost every time. The chart makes the same point visually: the observed and expected bars nearly coincide.
Reading a null result like an analyst
Three habits worth building. First, report the null plainly — "no detectable side effect in 10,756 shots" is a finding, and pretending otherwise is how folklore survives. Second, remember what the test can't see: this is league-aggregate data, and individual players certainly favor sides — aggregation cancels their tendencies, and a per-player test would be a different (and fun) analysis. Third, mind the multiple-comparisons trap: if you test twenty zone pairs, one will clear the bar by luck. One test, declared in advance, is what this method is for.
Troubleshooting
- My crosstab has a Center row. You filtered after building the table, or not at all — the
isin(["Left", "Right"])filter must run beforepd.crosstab. - My expected counts don't sum to the grand total. You've mixed integer division in somewhere — cast the observed matrix to float before the matrix multiply.
- SHOT_MADE parses as all-Missed. The column holds strings like
"True", not booleans — that's why the code lowercases and compares to"true"/"1"instead of using the raw column. - My chi-square is enormous. Check you divided by expected, not observed, and that no cell's expected count is near zero (with 10,756 shots split two ways, ours are in the thousands — the test's small-cell warnings don't apply here).
Challenge
Run the same test on a sharper question: corner threes only. Build the 2×2 of corner (Left Corner 3 / Right Corner 3) against outcome and compute the statistic — you'll find it also fails to reject, which is the final nail in the favorite-corner story at league level. Then try the test where it should fire: BASIC_ZONE (Restricted Area vs Above the Break 3) against outcome — distance effects are enormous, and the statistic will leave 3.841 far behind. Same four lines of numpy both times; only the question changes.
Download the script
The full script, ready to run - the finished script that generated every figure on this page.
Download the finished script (82_chi_square_shot_symmetry.py)This script imports a small shared helper (and reads any bundled sample data) that live next to it in /downloads/ — grab these into the same folder so it runs as-is: sdt_common.py, sdt_nba.py. Or skip the collecting: the Randomness, Inference & Simulation bundle has this whole course’s scripts and data in one ZIP.