Filtering and Querying a DataFrame
Part 4 of 10 in Python Foundations for Sports Data · course bundle (code + data)
What you'll build
A two-condition filter that finds the contenders, highlighted on a chart.
Most data questions are really filters. Which teams were good on both ends? Which players cleared a usage threshold? Which games were close? In pandas you answer them with a boolean mask — a column of True/False that selects the rows you want — or with the more readable .query() method. Master this one move and a 30-row table or a 30,000-row play-by-play log answers the same way. As a worked example I'll narrow a list of NBA teams down to the genuine two-way contenders — the ones good on both ends — and highlight them on a chart.
This builds on Pandas for Sports Data. The data is the bundled nba_ratings.csv (per-100-possession team ratings, Basketball-Reference, retrieved June 2026), so it runs offline.
-
A condition is a column of True/False
Comparing a column to a value doesn't return one answer — it returns a True/False value for every row. That boolean Series is the mask.
python import pandas as pd df = pd.read_csv("nba_ratings.csv") # Team, W, L, W/L%, ORtg, DRtg, NRtg lg_off = df["ORtg"].mean() lg_def = df["DRtg"].mean() above_avg_offense = df["ORtg"] > lg_off # a True/False Series, one per teamPut a mask inside
df[...]and pandas keeps only the True rows. The league-average offense and defense (about 116 points per 100 on each end) are our thresholds. -
Combine conditions — carefully
To demand both above-average offense and above-average defense (a lower defensive rating is better), combine masks with
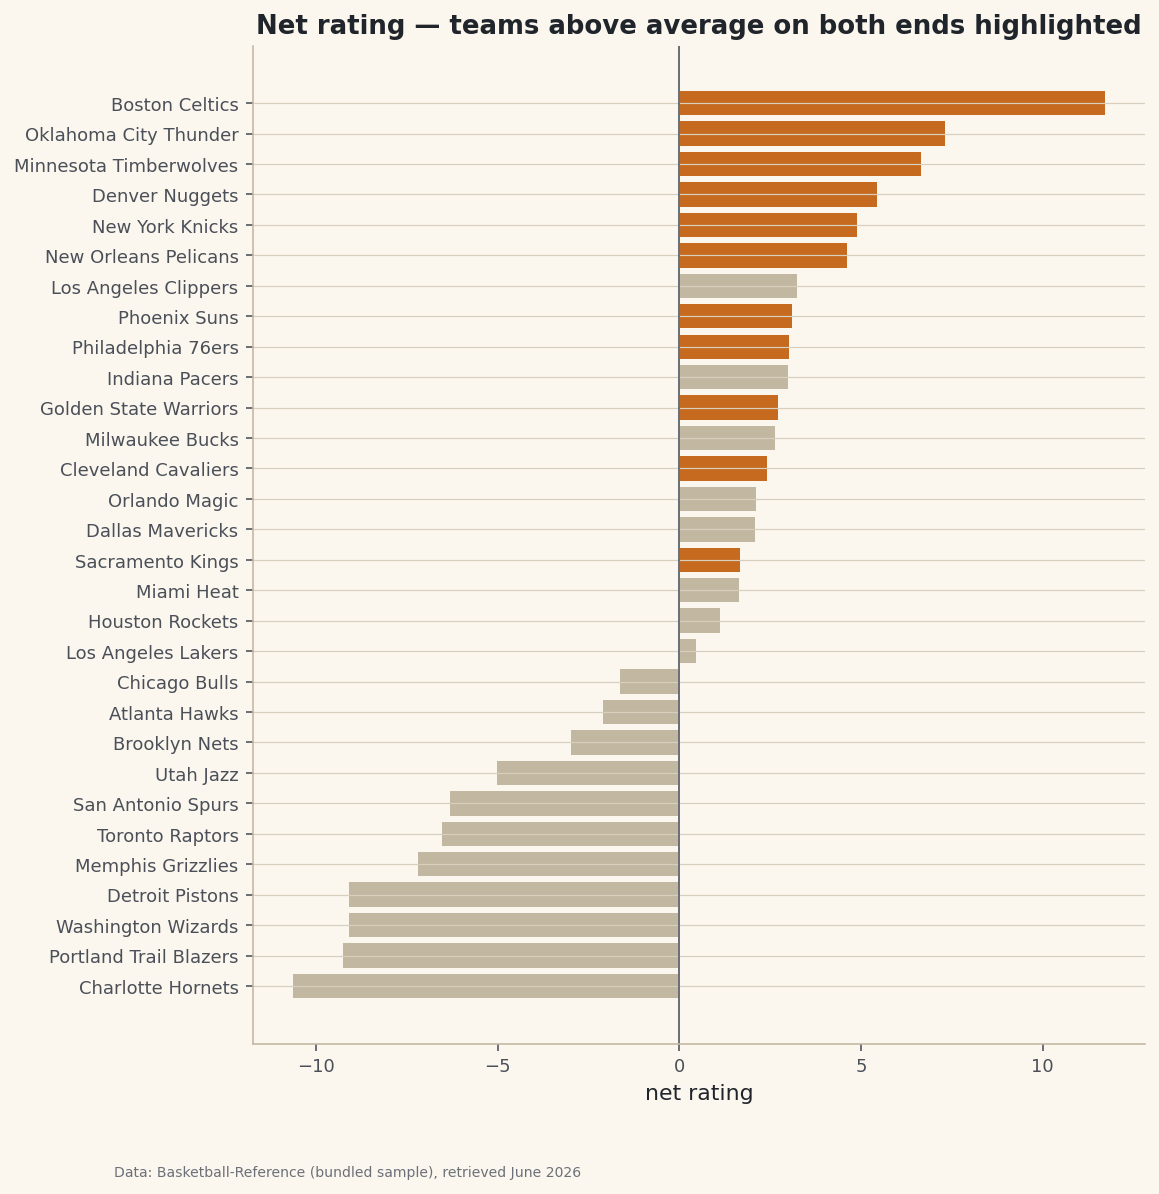
&, and wrap each condition in parentheses.python mask = (df["ORtg"] > lg_off) & (df["DRtg"] < lg_def) contenders = df[mask].sort_values("NRtg", ascending=False) # The same question reads more like English with .query(): # contenders = df.query("ORtg > @lg_off and DRtg < @lg_def") print(f"{len(contenders)} of {len(df)} teams clear both bars") print(contenders[["Team", "ORtg", "DRtg", "NRtg"]].to_string())Teams above average on both endsTeams above average on BOTH ends: 11 of 30 Team ORtg DRtg NRtg 0 Boston Celtics 124.23 112.51 11.71 1 Oklahoma City Thunder 120.43 113.12 7.31 2 Minnesota Timberwolves 116.63 109.98 6.65 3 Denver Nuggets 119.49 114.05 5.44 4 New York Knicks 119.11 114.22 4.89 5 New Orleans Pelicans 118.31 113.70 4.61 7 Phoenix Suns 118.78 115.69 3.09 8 Philadelphia 76ers 117.79 114.76 3.02 10 Golden State Warriors 118.67 115.95 2.72 12 Cleveland Cavaliers 116.21 113.80 2.41 15 Sacramento Kings 117.68 116.01 1.67Eleven of the thirty teams were above average on both ends — the Celtics leading the group with a +11.7 net rating. Note the two ways to ask: the bracket-and-mask form is explicit, while
.query()reads like a sentence (the@tells itlg_offis a Python variable, not a column). -
Highlight the filtered set
Filtering is most persuasive when you can see what was kept. We'll chart every team's net rating and color only the contenders.
python import matplotlib.pyplot as plt ordered = df.sort_values("NRtg") elite = set(contenders["Team"]) colors = ["#C56A1E" if t in elite else "#C2B7A1" for t in ordered["Team"]] fig, ax = plt.subplots(figsize=(8, 9)) ax.barh(ordered["Team"], ordered["NRtg"], color=colors) ax.axvline(0, color="#6C7079") fig.savefig("filtered_bar.png", dpi=144, bbox_inches="tight")Data: Bundled sample (NBA team ratings), retrieved June 2026 The highlighted bars are the rows our mask kept. Building the color list is itself a tiny filter — a comprehension that checks membership in the
eliteset team by team — which is a handy pattern any time you want to draw attention to a subset without dropping the rest.
Troubleshooting
I get "truth value of a Series is ambiguous"
You combined conditions with Python's and/or. On Series you must use the element-wise operators & and | — and wrap each condition in parentheses, because & binds tighter than >.
.query() can't see my variable
Prefix it with @: df.query("ORtg > @lg_off"). Without the @, query looks for a column named lg_off and fails. Column names with spaces or slashes need backticks inside the query string.
The filtered frame is empty
Your conditions never overlap. Test them one at a time (mask.sum() counts the True rows) to see which one is too strict, and double-check the direction of each comparison — for defensive rating, remember lower is better, so the good teams are below average.
Challenge yourself
Swap the numeric filter for a membership filter: use df[df["Team"].isin([...])] to pull a handful of teams by name, or filter to a division. Then add a third condition to the mask (say, a winning record) and watch the contender list shrink — a good feel for how each clause narrows the field.
Download the script
The full script, ready to run - the same file that generated every figure on this page.
Download the finished script (48_filtering_and_querying_dataframes.py)This script imports a small shared helper (and reads any bundled sample data) that live next to it in /downloads/ — grab these into the same folder so it runs as-is: sdt_common.py, sdt_nba.py. Or skip the collecting: the Python Foundations for Sports Data bundle has this whole course’s scripts and data in one ZIP.


