Outlier Detection: IQR Fences and the Modified Z-Score
Part 8 of 12 in Statistics for Sports Data · course bundle (code + data)
What you'll build
1,231 real NBA game margins flagged for outliers three ways - IQR (Tukey) fences, the modified z-score using the median and MAD, and the fragile plain z-score - with the fences drawn on the distribution and the blowouts highlighted.
"That result is an outlier" is a claim you can make precise instead of leaving to gut feel. The obvious tool is the z-score — how many standard deviations from the mean — but it hides a fatal flaw: the mean and standard deviation it depends on are themselves yanked around by the very extreme values you're trying to catch. A few blowouts inflate the SD, which shrinks everyone's z-score, which lets those same blowouts hide. Two robust methods dodge the trap: the IQR fences and the modified z-score built on the median and MAD. We'll flag NBA blowout games three ways and watch the methods disagree.
This builds on Summary Statistics and Distributions and is the analytical companion to Box Plots — a box plot draws the IQR fences; here we compute them and act on them. The data is the bundled nba_home_results.csv (real 2023-24 games), so it runs offline.
-
Method 1: IQR (Tukey) fences
Take the middle 50% of the data — the gap from the 25th to the 75th percentile, the interquartile range. Anything more than 1.5 IQRs beyond either quartile is an outlier. Because quartiles ignore the tails, a handful of extremes can't move the fences.
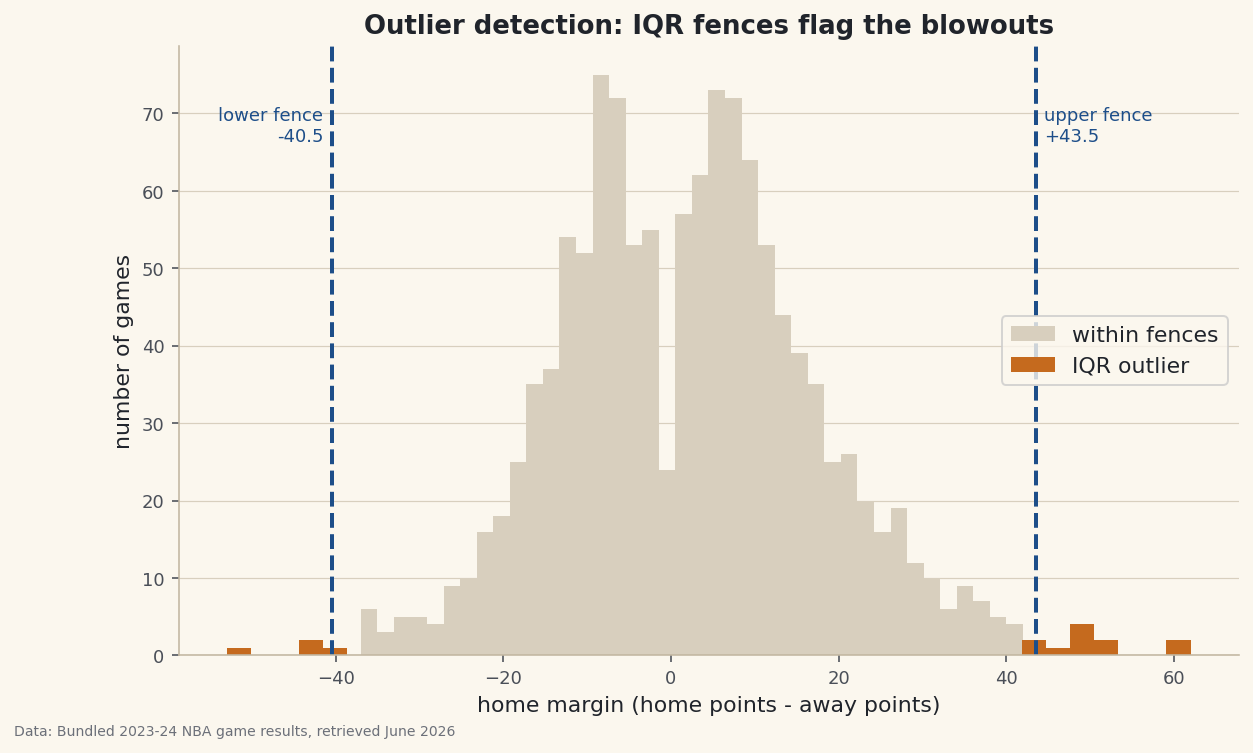
python import numpy as np, pandas as pd df = pd.read_csv("nba_home_results.csv") margin = (df.home_pts - df.away_pts).to_numpy(float) # home - away, per game q1, q3 = np.percentile(margin, [25, 75]); iqr = q3 - q1 lo, hi = q1 - 1.5*iqr, q3 + 1.5*iqr iqr_out = (margin < lo) | (margin > hi)The fences land at -40.5 and +43.5 points, flagging 15 games. Those are the true routs — a 40-plus point margin is genuinely off the map for an NBA game.
-
Method 2: the modified z-score (median + MAD)
The modified z-score is the plain z-score with its fragile pieces swapped for robust ones: the median replaces the mean, and the MAD — the median absolute deviation from the median — replaces the SD. The 0.6745 constant rescales MAD so the cutoff of 3.5 means roughly the same thing a z-score of 3.5 would.
python med = np.median(margin) mad = np.median(np.abs(margin - med)) mod_z = 0.6745 * (margin - med) / mad mad_out = np.abs(mod_z) > 3.5 z = (margin - margin.mean()) / margin.std() # the fragile one, for contrast z_out = np.abs(z) > 3.0Three methods, three different countsGames: 1231 margin mean +2.16 median +2.0 IQR fences: Q1=-9 Q3=12 IQR=21 -> keep [-40.5, 43.5] MAD = 10.0 (mean-based SD = 15.6, inflated by the blowouts) Outliers flagged: IQR fences 15 modified-z 3 plain z 7
Here's the tell. The MAD is 10.0, but the mean-based standard deviation is 15.6 — inflated by more than half by the blowouts themselves. That inflation is why the three methods flag different counts: IQR fences catch 15 games, the modified z-score a strict 3, and the plain z-score 7. Same data, same question, three answers — and the plain z-score's answer is the one you can least trust, because its yardstick was bent by the outliers.
-
See the fences on the distribution
Draw the margin histogram, recolor the games past the fences, and mark the fences themselves. The outliers are the sparse bars in the far tails.
python import matplotlib.pyplot as plt fig, ax = plt.subplots() ax.hist(margin[~iqr_out], bins=40, color="#D8CFBE") ax.hist(margin[iqr_out], bins=40, color="#C56A1E") for x in (lo, hi): ax.axvline(x, ls="--") fig.savefig("outlier_fences.png", dpi=144, bbox_inches="tight")Data: Bundled sample (real 2023-24 NBA game results), retrieved June 2026 The routs, by nameThe five biggest blowouts (all flagged by every method): 2024-01-11 +62 Oklahoma City Thunder vs Portland Trail Blazers 2024-03-29 +60 Miami Heat vs Portland Trail Blazers 2023-12-16 -53 Charlotte Hornets vs Philadelphia 76ers 2024-03-03 +52 Boston Celtics vs Golden State Warriors 2023-11-01 +51 Boston Celtics vs Indiana Pacers
The five biggest are real, nameable games — Oklahoma City over Portland by 62, Miami over Portland by 60. Every method agrees on these; the disagreement is only about the borderline 40-something-point games. Which cutoff you use depends on the job: IQR fences for a permissive "worth a look" flag, the modified z-score when you want to be conservative and only call the undeniable extremes.
Troubleshooting
My MAD is zero and the modified z-score is all inf
MAD is zero when more than half the values are identical — common for discrete or heavily-tied data — so dividing by it explodes. Fall back to the IQR method, or use a MAD variant that averages the two middle absolute deviations. It's a signal your data is too lumpy for a spread-based rule in the first place.
Which cutoff is correct, 1.5 IQR or 3.5 modified-z?
Neither is a law — both are conventions. 1.5 IQR is Tukey's rule of thumb (3.0 IQR marks "far out" outliers); 3.5 is the standard modified-z cutoff. Pick by consequence: a screening pass that will be reviewed by hand can afford the permissive fence, while an automatic reject rule should use the stricter one. State whichever you chose.
Should I delete the outliers?
Usually no. Flagging is not the same as deleting. A 62-point NBA win is a real, correct data point, not an error — dropping it would bias any average downward. Delete only genuine mistakes (a typo'd 620-point game). For real-but-extreme values, prefer robust statistics or winsorizing over deletion.
Challenge yourself
Winsorize the margins — clip everything past the fences to the fence value — and compare the mean and SD before and after to see how much the tails were pulling them. Then run all three detectors on a per-team basis to find which teams produced the most blowouts, in either direction. Finally, apply the modified z-score to a stat with a genuine heavy tail, like individual scoring, and check whether "outlier" there means "error" or "superstar" — the method can't tell you which, only that the point is far out.
Get the code
Want it all in one file? This is the finished script behind this tutorial - the run that produced the outputs above.
Download the finished script (80_outlier_detection_iqr_mad.py)This script imports a small shared helper (and reads any bundled sample data) that live next to it in /downloads/ — grab these into the same folder so it runs as-is: sdt_common.py. Or skip the collecting: the Statistics for Sports Data bundle has this whole course’s scripts and data in one ZIP.