Standardize Stats with Z-Scores: Compare Columns on One Scale
Part 3 of 11 in Statistics for Sports Data · course bundle (code + data)
What you'll build
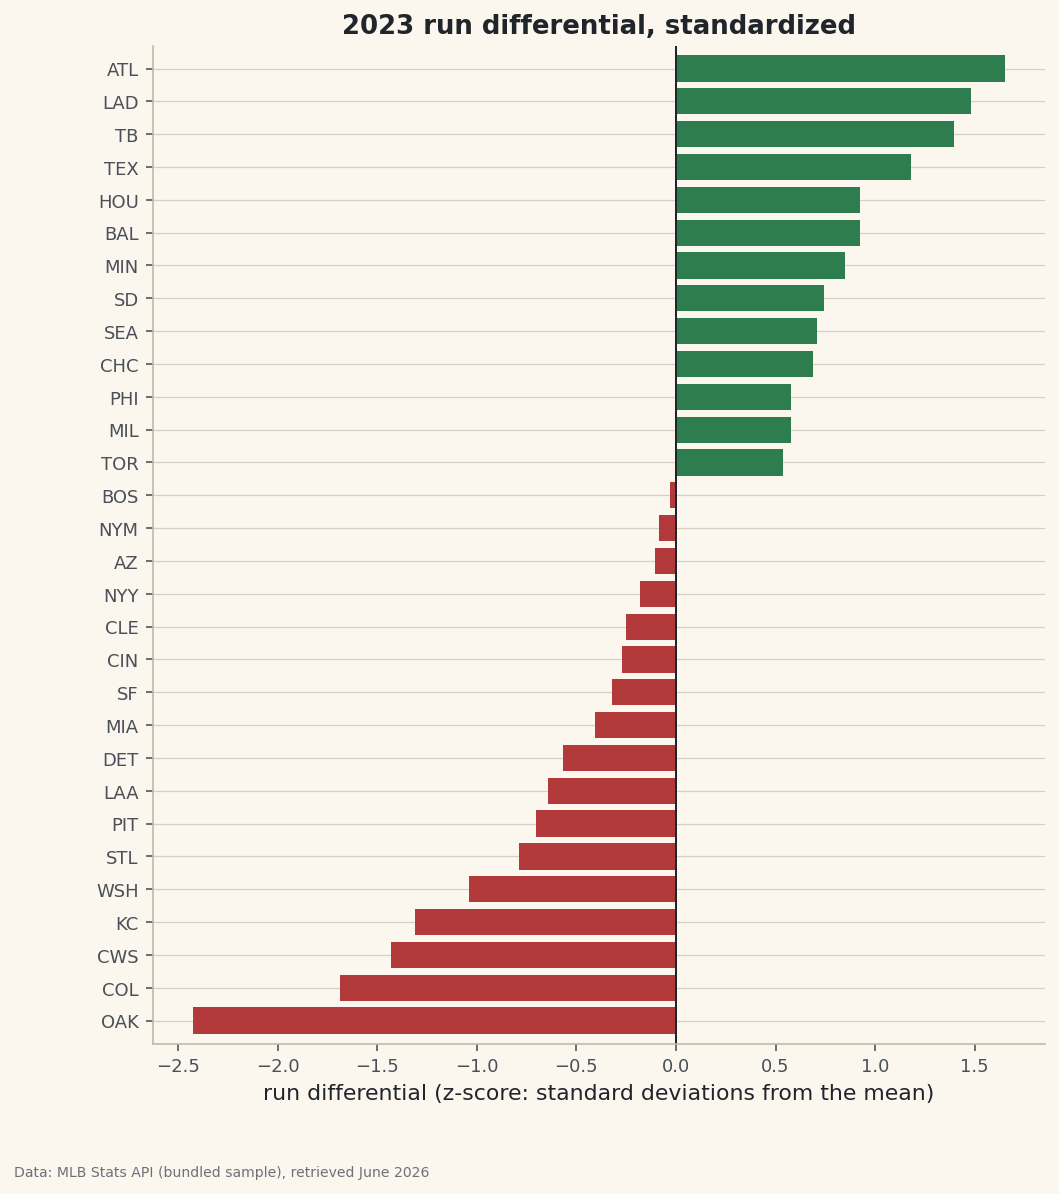
A diverging bar chart of every team's run differential, expressed in standard deviations from the mean.
How do you compare a team that scores a lot of runs with one that prevents a lot of runs? Runs scored and runs allowed sit on the same numeric scale here, but plenty of stats don't — on-base percentage lives near 0.3, strikeouts in the hundreds. The fix is the z-score: rescale any column to "how many standard deviations from the mean", and suddenly +1.0 means the same thing everywhere. We'll standardize three columns of the 2023 standings and read the result straight off a diverging bar chart.
This builds on Summary Statistics and Distributions, where mean() and std() first showed up. Everything here runs on the bundled sample_standings.csv, a real copy of the 2023 MLB standings, fully offline.
Go deeper with the free textbook: Numerical Summaries at DataField.dev.
-
The formula in one function
A z-score is just
(value − mean) ÷ standard deviation. Wrap it in a tiny function and it applies to any column. We standardize runs scored, runs allowed, and run differential in a single loop.python import pandas as pd df = pd.read_csv("sample_standings.csv") def zscore(s): return (s - s.mean()) / s.std() # pandas std() uses ddof=1 (sample std) for col in ["RS", "RA", "RunDiff"]: df[col + "_z"] = zscore(df[col]) print(df.sort_values("RunDiff_z", ascending=False) [["Team", "RS", "RS_z", "RA", "RA_z", "RunDiff_z"]].round(2).head(8).to_string())Standardized leaders (and the tell-tale mean/std)Team RS RS_z RA RA_z RunDiff_z 0 Braves 947 2.40 716 -0.39 1.65 2 Dodgers 906 1.91 699 -0.59 1.48 3 Rays 860 1.35 665 -1.01 1.39 7 Rangers 881 1.61 716 -0.39 1.18 5 Astros 827 0.96 698 -0.61 0.92 1 Orioles 807 0.72 678 -0.85 0.92 10 Twins 778 0.37 659 -1.08 0.85 14 Padres 752 0.05 648 -1.21 0.74 mean RunDiff_z = 0.000 (≈0 by construction) std RunDiff_z = 1.000 (=1 by construction)
Read the Braves' row:
RS_zof about +2.4 means their offense was roughly two and a half standard deviations above league average, whileRA_zof −0.4 means a slightly better-than-average defense. The two columns are now directly comparable even though raw runs scored and runs allowed answer opposite questions. -
Why the mean is 0 and the std is 1
Standardizing always re-centers a column to mean 0 and spread 1 — that's the whole point, and it's a free sanity check. If your "z-score" column doesn't come out that way, you standardized the wrong thing.
python print(df["RunDiff_z"].mean()) # ≈ 0 print(df["RunDiff_z"].std()) # = 1This is also why z-scores are the backbone of composite ratings: because every input is on the same 0-centered, unit-1 scale, you can average a hitter's standardized power, discipline, and speed into one number without one stat drowning out the others.
-
A diverging bar chart reads off zero
Once a column is centered on zero, a diverging bar chart is the natural picture: bars to the right are above average, bars to the left below, and length is the magnitude in sigma. Color the two directions differently and the league splits in half at a glance.
python import matplotlib.pyplot as plt s = df.sort_values("RunDiff_z") colors = ["#2E7D4F" if v >= 0 else "#B23A3A" for v in s["RunDiff_z"]] fig, ax = plt.subplots(figsize=(8, 9)) ax.barh(s["Abbr"], s["RunDiff_z"], color=colors) ax.axvline(0, color="#20242B", lw=1) ax.set_xlabel("run differential (z-score)") fig.savefig("zscore_bars.png", dpi=144, bbox_inches="tight")Data: Bundled sample (2023 MLB standings), retrieved June 2026 The shape is symmetric around zero because the average team, by definition, sits at the line. What the chart adds over raw run differential is interpretability: a bar at +2 isn't just "good", it's "top-of-the-distribution rare", and the same +2 would mean the same thing if the axis were on-base percentage or ERA.
Troubleshooting
My z-scores are slightly different from a colleague's
Almost always the ddof (degrees of freedom) in the standard deviation. pandas std() defaults to ddof=1 (sample std); numpy's np.std() defaults to ddof=0 (population). Pick one and be consistent — for ranking teams it barely moves the order, but the raw numbers won't match across tools unless the ddof does.
A z-score column came out all NaN
The column's standard deviation was zero (every value identical), so you divided by zero. That's rare for real stats but common for a constant column like games played — standardizing a column with no spread is meaningless, so skip it.
Should I standardize before or after filtering?
It depends on the reference group you mean. Standardize against the population you want "average" to describe. If you want a team's z-score relative to its league, compute the mean and std within that league (a groupby + transform), not across all 30 teams.
Challenge yourself
Build a tiny composite rating: standardize RS and RA (remember a lower RA is better, so flip its sign), average the two z-scores into a single balance score, and sort. Does the most balanced team match the one with the best raw run differential — or does z-scoring reward a team that's merely very good at one end?
Get the code
Want it all in one file? This is the exact script that produced the outputs above.
Download the finished script (53_standardize_stats_with_z_scores.py)This script imports a small shared helper (and reads any bundled sample data) that live next to it in /downloads/ — grab these into the same folder so it runs as-is: sdt_common.py. Or skip the collecting: the Statistics for Sports Data bundle has this whole course’s scripts and data in one ZIP.


