Rest Days and Back-to-Backs: Measuring the Schedule as a Player
Part 8 of 9 in Basketball Analytics with the NBA API · course bundle (code + data)
What you'll build
The 2023-24 results log reshaped into 2,462 team-games and each team's rest computed with one groupby diff: back-to-backs are 17.4% of the 2,432 team-games that follow a prior game and erase home court entirely (54.3% baseline falls to 47.3%), a rested-vs-tired matchup runs 41.9% and -2.77 a night across 308 games, and the rest-difference staircase climbs 48.3 to 60.7 - plus the In-Season Tournament final, the row standings drop and schedule math keeps.
Every results log you have used on this site quietly carries a second dataset: the schedule itself. Nothing but the dates in the bundled 2023-24 results log is enough to compute how much rest every team had before every game — and once you have that, you can measure one of basketball’s favorite folk theories. The measurements are blunt: an average team playing the second night of a back-to-back at home wins 47.3% of the time — a full home-court advantage, erased. On zero rest against a rested opponent, any venue, teams win 41.9% and get outscored by 2.77 points a game. And every team eats roughly 14 of those second nights a season. The schedule is not background; it is a player.
You need the standings tutorial (same CSV, and its In-Season Tournament lesson returns here with a twist) and groupby fluency. Everything runs offline from the bundled nba_home_results.csv — no API, no key — and the payoff at the end is a feature you were told to try in the logistic regression tutorial, now built properly.
-
Two tables, two questions — the row you keep this time
The log holds 1,231 rows: 1,230 regular-season games plus the In-Season Tournament final. The standings tutorial’s whole lesson was that the final must be dropped — it counts in the file but not in the standings. Schedule math flips that call. Both teams really did spend December 9 in Las Vegas playing that game, so deleting it would falsify the rest gaps of their next games. So we build two tables: a schedule table that keeps all 1,231 games, and an outcome table that drops the final (it decides no standings, and its “home court” was a neutral floor). Which rows you drop depends on the question, not on the file.
python import pandas as pd games = pd.read_csv("nba_home_results.csv", parse_dates=["date"]) games["margin"] = games["home_pts"] - games["away_pts"] games["game_id"] = games.index ist_final = games["date"] == "2023-12-09" outcomes = games[~ist_final].copy() print(len(games), "games for schedule math,", len(outcomes), "for outcomes")1,231 games; the one row standings drop and schedule math keeps1231 games in the log, 2023-10-24 to 2024-04-14 The one row standings must drop and schedule math must keep: date away_team away_pts home_team home_pts 321 2023-12-09 Indiana Pacers 109 Los Angeles Lakers 123 schedule table: 1231 games outcome table: 1230 gamesOne more venue footnote for honesty: the two tournament semifinals (December 7) were also played in Las Vegas, but they count as regular-season games in the official standings, so they stay in the outcome table — consistent with the record books, slightly unfair to the phrase “home court.”
-
One game, two team-games — then rest is a single diff
Rest is a team property, not a game property, so reshape: each game becomes two rows, one per team. Sort by team and date, and each team’s gap to its previous game is one
groupby().diff(). We define rest as full days off between games — play Tuesday then Wednesday and that is a gap of 1 day, 0 days rest, a back-to-back. Season openers have no prior game and stay honestly missing.python home = games.rename(columns={"home_team": "team", "away_team": "opponent", "home_pts": "pts_for", "away_pts": "pts_against"}) home["is_home"] = True away = games.rename(columns={"away_team": "team", "home_team": "opponent", "away_pts": "pts_for", "home_pts": "pts_against"}) away["is_home"] = False cols = ["game_id", "date", "team", "opponent", "is_home", "pts_for", "pts_against"] tg = pd.concat([home[cols], away[cols]]).sort_values(["team", "date"]) tg["rest"] = tg.groupby("team")["date"].diff().dt.days - 1 print(tg["rest"].value_counts().sort_index().head(6))2,462 team-games: how often teams actually play tired2462 team-games from 1231 games; 30 season openers have no prior game rest before a game (full days off), share of the 2,432 team-games with a known prior game: 0 days rest 422 17.4% 1 days rest 1538 63.2% 2 days rest 359 14.8% 3+ days rest 113 4.6% second nights of a back-to-back per team: mean 14.1, min 13, max 17 share of zero-rest games played on the road: 51.9%
Three reads before any win rate. Zero-rest games are 17.4% of the 2,432 team-games that follow a prior game (the 30 season openers have no rest to measure) — roughly one game in six is played by a team that played yesterday. The load is nearly flat across the league: every team drew between 13 and 17 second nights. And a number that should adjust your priors: only 51.9% of zero-rest games are on the road. The back-to-back penalty we are about to measure is not just a road-trip artifact wearing a disguise — teams play tired at home almost as often as away.
-
What zero rest does to winning
Join each game’s two rest values back onto the outcome table and split the season into four situations. The baseline home win rate is 54.3%. Now watch it move.
python rest = tg.set_index(["game_id", "team"])["rest"] outcomes["home_rest"] = [rest.get((g, t)) for g, t in zip(outcomes.game_id, outcomes.home_team)] outcomes["away_rest"] = [rest.get((g, t)) for g, t in zip(outcomes.game_id, outcomes.away_team)] known = outcomes.dropna(subset=["home_rest", "away_rest"]) for label, d in [("home on zero rest", known[known.home_rest == 0]), ("away on zero rest", known[known.away_rest == 0])]: print(label, round(100 * (d.margin > 0).mean(), 1), "%")Home court, with and without a night of sleepoutcome sample: 1215 games with both rests known home win rate overall: 54.3% home on zero rest home wins 47.3% avg margin -0.14 n=203 away on zero rest home wins 58.9% avg margin +3.77 n=219 both on zero rest home wins 52.6% avg margin +3.04 n=57 neither on zero rest home wins 54.7% avg margin +2.34 n=850 the classic cut - on zero rest against a rested opponent: win rate 41.9%, net margin -2.77 per game, n=308 (53% on the road)
The top line is the finding: a home team on zero rest wins 47.3% — below a coin flip, in front of its own crowd. The entire home-court advantage this site has measured across five leagues is spent covering one missing night of rest. The bottom line is the classic scheduling cut: a team on zero rest facing a rested opponent — 308 such games — wins 41.9% and loses the scoreboard by 2.77 a night. That is what coaches mean when they circle “schedule losses” in October.
-
The gradient: rest difference against home win rate
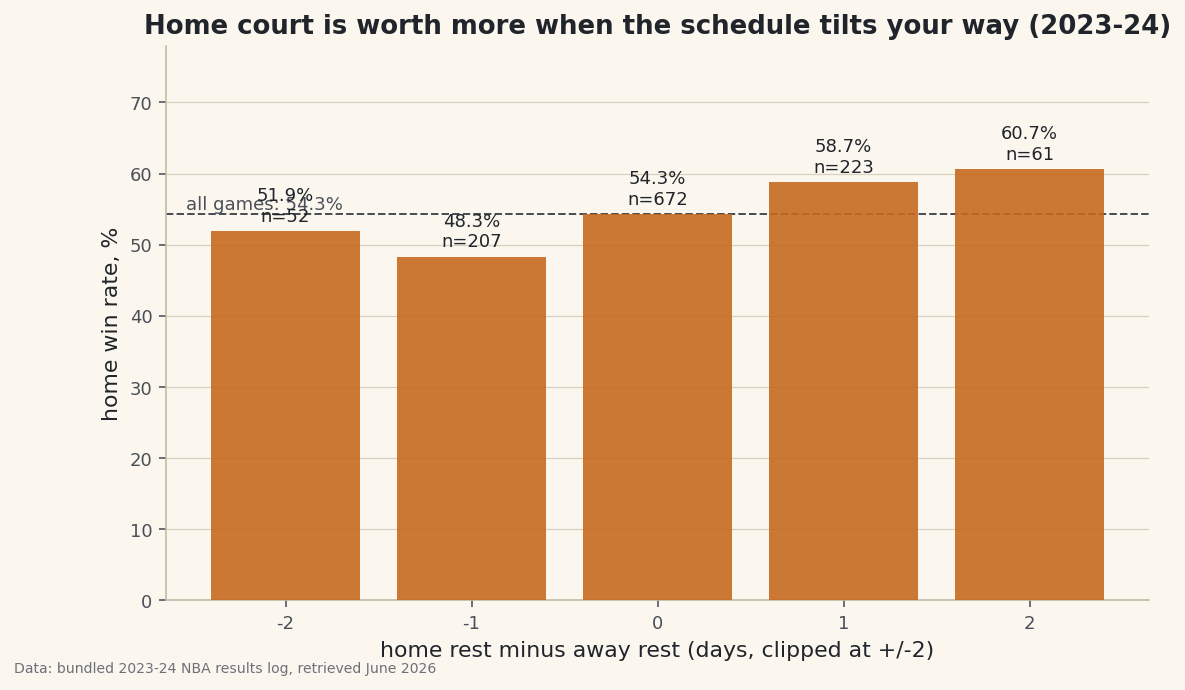
Collapse both rests into one number — home rest minus away rest, clipped at ±2 — and the picture organizes itself into a staircase.
python import numpy as np known = known.copy() known["rest_diff"] = (known.home_rest - known.away_rest).clip(-2, 2) for d in [-2, -1, 0, 1, 2]: s = known[known.rest_diff == d] print(f"{d:+d} home wins {100 * (s.margin > 0).mean():4.1f}% n={len(s)}") print("corr:", round(np.corrcoef(known.rest_diff, known.margin)[0, 1], 3))Home win rate by rest difference, 2023-24home win rate by rest difference (home rest minus away rest, clipped): -2 away much more rested 51.9% margin -0.38 n=52 -1 away more rested 48.3% margin +0.10 n=207 +0 equal rest 54.3% margin +2.37 n=672 +1 home more rested 58.7% margin +3.21 n=223 +2 home much more rested 60.7% margin +4.98 n=61 corr(rest difference, home margin) = 0.078 - real, and small
Data: Bundled (2023-24 NBA results log), retrieved August 2026 (complete 2023-24 season) From −1 to +2 the staircase is clean: 48.3%, 54.3%, 58.7%, 60.7%. A home team with any rest edge at all plays like a 59% team; give the edge to the visitors and home court nearly vanishes. Note the honest wrinkle at −2, which breaks the pattern at 51.9% — that bucket holds 52 games, many following the All-Star break, and a 52-game win rate carries an uncertainty of about ±14 points. We report it and decline to narrate it. The correlation with margin, 0.078, says the true size: real, and small — rest tilts games; it does not decide seasons.
-
What this measurement can and cannot claim
Three limits worth stating plainly. First, this is one season; the staircase’s shape recurs across seasons in published work, but the exact percentages here are 2023-24’s. Second, rest is not randomly assigned — the league builds schedules under constraints, so some of the “rest effect” is entangled with when and where tired games land; we controlled the venue split by measuring from the home bench, not with a model. Third, the file has dates but not distances — a back-to-back across a time zone and one across a hallway look identical here. The step up from this tutorial is exactly the one the logistic regression left you: add
rest_diffas a feature next to home court and let the model price both at once. You now know what coefficient it should hand back — positive, and worth a bit under a tenth of a standard deviation of margin.
Download the script
The full script, ready to run - the finished script that generated every figure on this page.
Download the finished script (90_rest_days_and_back_to_backs.py)This script imports a small shared helper (and reads any bundled sample data) that live next to it in /downloads/ — grab these into the same folder so it runs as-is: sdt_common.py, sdt_nba.py. Or skip the collecting: the Basketball Analytics with the NBA API bundle has this whole course’s scripts and data in one ZIP.