Team Luck with PDO: the Number That Flags Hot Streaks
Part 4 of 5 in Hockey & Cross-League Projects · course bundle (code + data)
What you'll build
PDO computed for all 32 teams across the two most recent completed NHL seasons from the keyless public stats API: the league pinned at exactly 100 by arithmetic, a 0.63 same-season correlation with points, the year-over-year test (PDO r = 0.26) - and the decomposition: the shooting half persists at 0.37 while the save half manages 0.06. 2024-25's five lowest-PDO teams improved the next season five for five.
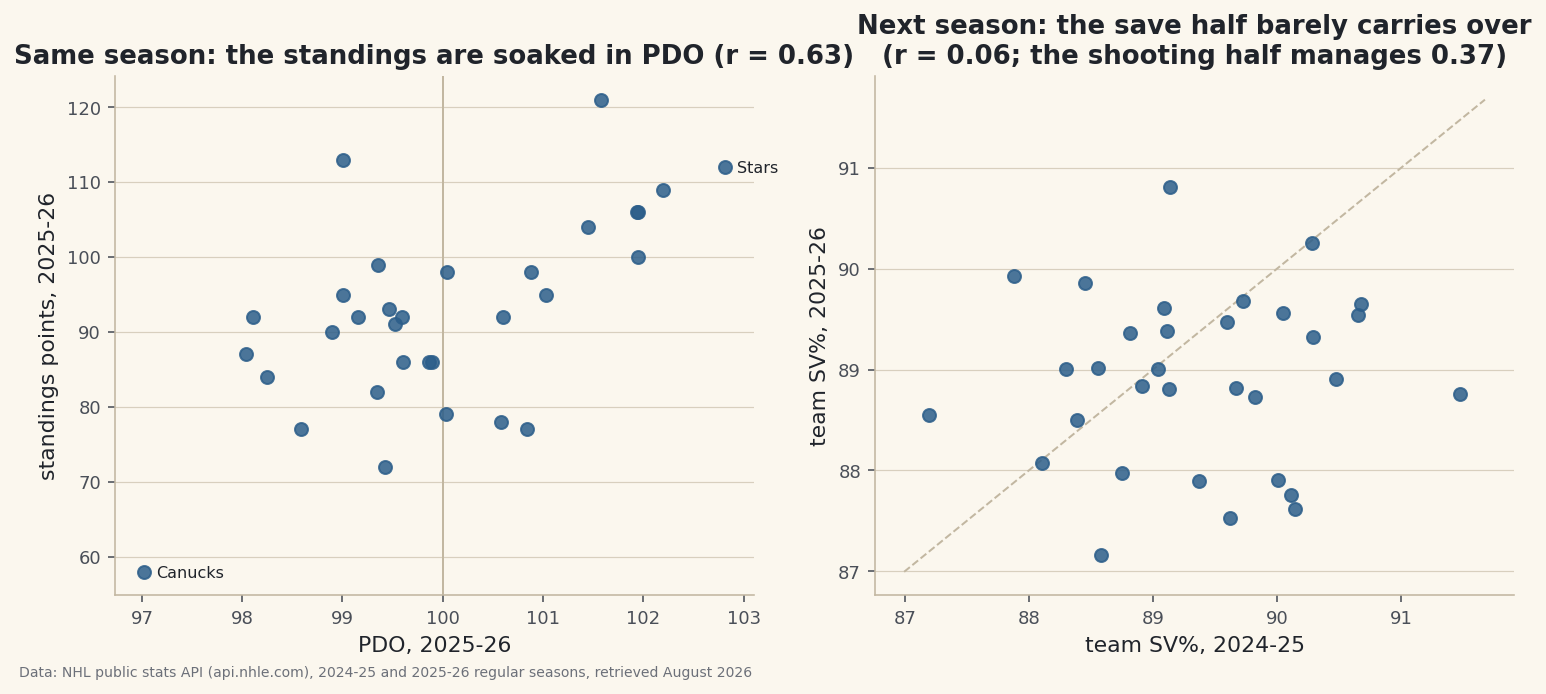
Every hockey winter produces a team nobody rated sitting third overall in January, and one word does more work explaining it than any other: PDO — shooting percentage plus save percentage, scaled so the league sits at 100. The folk version says PDO is luck, full stop: anything far from 100 “always regresses.” That version is half right, and this tutorial computes which half. We pull all 32 teams for the two most recent completed seasons from the NHL’s keyless public stats API, pin down why the league averages exactly 100 (it’s arithmetic, not tendency), measure how much of the standings PDO soaks — r = 0.63 in 2025-26 — and then run the only test that matters: does it carry over? Year over year, PDO persists at 0.26… and splits into a shooting half that keeps real talent (0.37) and a save half that keeps almost none (0.06). The half everyone credits to goaltending is the half that vanishes.
You have the machinery already: the NHL API basics, correlation, and regression to the mean, which this is hockey’s favorite special case of. The fetch step needs a live connection; everything after it runs from the bundled nhl_team_pdo_two_seasons.csv the script saves, so the analysis reproduces offline, byte for byte.
-
Pull two complete seasons of team summaries
The stats endpoint takes a
cayenneExpfilter — season and game type — and returns one row per team: goals for and against, shots for and against per game, points. Two calls, 64 rows, no API key. One honesty detail: the Utah franchise renamed between these seasons (Hockey Club → Mammoth), so we map the names to keep it one franchise — otherwise every year-over-year join silently drops a team.python import pandas as pd import requests SEASONS = {"2024-25": 20242025, "2025-26": 20252026} RENAME = {"Utah Hockey Club": "Utah Mammoth"} rows = [] for label, sid in SEASONS.items(): url = ("https://api.nhle.com/stats/rest/en/team/summary" f"?cayenneExp=seasonId={sid}%20and%20gameTypeId=2") for t in requests.get(url, timeout=30).json()["data"]: gp = t["gamesPlayed"] rows.append({"team": RENAME.get(t["teamFullName"], t["teamFullName"]), "season": label, "gp": gp, "points": t["points"], "gf": t["goalsFor"], "ga": t["goalsAgainst"], "shots_for": round(t["shotsForPerGame"] * gp), "shots_against": round(t["shotsAgainstPerGame"] * gp)}) df = pd.DataFrame(rows) df.to_csv("nhl_team_pdo_two_seasons.csv", index=False)Two seasons, 32 franchises64 team-seasons from live pull: 2 seasons x 32 franchises (Utah's rename is mapped: Hockey Club and Mammoth are one franchise.) team points gf shots_for sh_pct sv_pct pdo 38 Dallas Stars 112 273 2074 13.162970 89.650350 102.813320 58 Buffalo Sabres 109 283 2306 12.272333 89.928661 102.200994 44 Boston Bruins 100 268 2216 12.093863 89.856263 101.950126 48 Tampa Bay Lightning 106 286 2305 12.407809 89.538602 101.946411 50 Montréal Canadiens 106 279 2156 12.940631 89.000876 101.941507 -
Compute PDO — and see why the league averages exactly 100
Team shooting percentage is goals for over shots for; team save percentage is one minus goals against over shots against; PDO is their sum, in percentage points. Before looking at any team, check the league totals — because every goal scored is somebody else’s goal allowed and every shot taken is somebody else’s shot faced, the league’s SH% and SV% are the same fraction viewed from opposite benches. They must sum to 100. PDO doesn’t hover near 100 out of cosmic fairness; it averages 100 by construction, which is exactly what makes deviations from it readable.
python import pandas as pd df = pd.read_csv("nhl_team_pdo_two_seasons.csv") df["sh_pct"] = 100 * df["gf"] / df["shots_for"] df["sv_pct"] = 100 * (1 - df["ga"] / df["shots_against"]) df["pdo"] = df["sh_pct"] + df["sv_pct"] for label, d in df.groupby("season"): lg_sh = 100 * d["gf"].sum() / d["shots_for"].sum() lg_sv = 100 * (1 - d["ga"].sum() / d["shots_against"].sum()) print(label, round(lg_sh, 2), "+", round(lg_sv, 2), "=", round(lg_sh + lg_sv, 2))The league identity: SH% + SV% = 100, both seasons2024-25: league SH% 10.65 + league SV% 89.35 = 100.00 2025-26: league SH% 11.07 + league SV% 88.93 = 100.00 Every goal scored is a goal allowed and every shot taken is a shot faced, so the league's SH% and SV% are the same fraction seen from both benches. PDO does not hover near 100 by tendency - it averages 100 by arithmetic.
A scope note before the leaderboards: classic PDO is a 5-on-5, on-ice stat. What we’re computing is the all-situations, team-season version — the same idea with power plays and empty-netters left in, because that’s what the summary endpoint carries. It runs a touch wider than 5v5 PDO, and everything below says so when it matters.
-
Read a season’s leaders and laggards
Sort 2025-26 by PDO and look at both tails next to the points column. The whole league lives inside about six points of PDO — a standard deviation of 1.4 — and yet the correlation between PDO and standings points is 0.63. Meaning: a big share of what the standings call “good” in any single season is teams sitting on the friendly end of two percentages.
python cur = df[df.season == "2025-26"].set_index("team") print(cur.nlargest(5, "pdo")[["pdo", "sh_pct", "sv_pct", "points"]].round(2)) print(cur.nsmallest(5, "pdo")[["pdo", "sh_pct", "sv_pct", "points"]].round(2)) print("r(PDO, points):", cur["pdo"].corr(cur["points"]).round(2))2025-26 PDO leaders, laggards, and the same-season correlation2025-26 PDO leaders and laggards (all situations, team level): Dallas Stars PDO 102.8 SH% 13.16 SV% 89.65 pts 112 Buffalo Sabres PDO 102.2 SH% 12.27 SV% 89.93 pts 109 Boston Bruins PDO 102.0 SH% 12.09 SV% 89.86 pts 100 Tampa Bay Lightning PDO 101.9 SH% 12.41 SV% 89.54 pts 106 Montréal Canadiens PDO 101.9 SH% 12.94 SV% 89.00 pts 106 Vancouver Canucks PDO 97.0 SH% 9.86 SV% 87.16 pts 58 New Jersey Devils PDO 98.0 SH% 9.32 SV% 88.73 pts 87 Anaheim Ducks PDO 98.1 SH% 10.49 SV% 87.62 pts 92 Florida Panthers PDO 98.2 SH% 10.72 SV% 87.53 pts 84 Calgary Flames PDO 98.6 SH% 9.02 SV% 89.56 pts 77 spread: mean 100.0, sd 1.36, range 97.0 to 102.8 same-season r(PDO, points) = 0.63 - the standings are soaked in it
Notice how teams get to the same PDO: Montréal’s 101.9 is shooting-heavy (12.94, with an ordinary save percentage), Buffalo’s 102.2 leans on the netminding. The sum treats those identically. The decomposition in the next step is why you shouldn’t.
-
The test that settles it: does PDO carry over?
“Luck” has a measurable signature: it doesn’t repeat. Join the two seasons on franchise and correlate everything with its own next-year value. If the folk claim were fully right, PDO’s year-over-year r would sit near zero. It doesn’t — and the split is the real lesson.
python cur = df[df.season == "2025-26"].set_index("team") prev = df[df.season == "2024-25"].set_index("team") both = cur.join(prev, lsuffix="_26", rsuffix="_25", how="inner") for a, b, label in [("pdo_25", "pdo_26", "PDO"), ("points_25", "points_26", "points"), ("sh_pct_25", "sh_pct_26", "shooting half"), ("sv_pct_25", "sv_pct_26", "save half")]: print(label, both[a].corr(both[b]).round(2))Year-over-year persistence, 2024-25 to 2025-26Year-over-year persistence, 32 franchises, 2024-25 -> 2025-26: r(PDO ) = 0.26 r(points ) = 0.22 r(SH% (shooting half) ) = 0.37 r(SV% (save half) ) = 0.06 The half of PDO everyone credits to goaltending is the half that vanishes.
PDO persists at 0.26 — not zero, because rosters carry real finishing talent, and the shooting half shows it at 0.37. But the save half — the part broadcast crews narrate as a goalie’s ability — correlates with itself at 0.06 across seasons. One season of team save percentage is close to uninformative about the next. That is regression to the mean wearing a goalie mask, and it’s why analysts treat a save-percentage-driven standings run as borrowed points.
Data: NHL public stats API (live pull; bundled two-season CSV fallback), retrieved August 2026 -
Use it the way it deserves: as a watchlist
The payoff table. Take 2024-25’s five highest-PDO teams and five lowest, and check their point totals a season later. The high five include the season’s two loudest collapses — and the low five improved five for five, by an average of 21 points.
python top5 = both.nlargest(5, "pdo_25") bot5 = both.nsmallest(5, "pdo_25") print(top5[["pdo_25", "points_25", "points_26"]].round(1)) print(bot5[["pdo_25", "points_25", "points_26"]].round(1))2024-25's PDO extremes, one season later2024-25's five highest-PDO teams, one season later: Winnipeg Jets PDO 103.4 -> pts 116 -> 82 (-34) Tampa Bay Lightning PDO 103.1 -> pts 102 -> 106 (+4) Dallas Stars PDO 102.5 -> pts 106 -> 112 (+6) Washington Capitals PDO 102.4 -> pts 111 -> 95 (-16) Toronto Maple Leafs PDO 102.1 -> pts 108 -> 78 (-30) 2024-25's five lowest-PDO teams, one season later: Nashville Predators PDO 97.1 -> pts 68 -> 86 (+18) San Jose Sharks PDO 97.5 -> pts 52 -> 86 (+34) Philadelphia Flyers PDO 97.7 -> pts 76 -> 98 (+22) New York Islanders PDO 98.3 -> pts 82 -> 91 (+9) Boston Bruins PDO 98.7 -> pts 76 -> 100 (+24) scoreboard: 3 of 5 high-PDO teams fell, 5 of 5 low-PDO teams improved.
Read it with both eyes open. Winnipeg’s 103.4 rode the league’s best goaltending to 116 points and gave back 34 of them; Toronto gave back 30. But Dallas and Tampa held — high-PDO teams that were also simply good. That’s the correct final shape of the idea: PDO is not a verdict, it’s a flag. An extreme value tells you which teams’ records are running ahead of (or behind) their underlying play, and the save-percentage half tells you which flavor of extreme is least likely to survive the summer. Luck isn’t the absence of skill; it’s the part of the skill-shaped number that doesn’t come back.
Download the script
The full script, ready to run - the finished script that generated every figure on this page.
Download the finished script (88_team_luck_with_pdo.py)This script imports a small shared helper (and reads any bundled sample data) that live next to it in /downloads/ — grab these into the same folder so it runs as-is: sdt_common.py. Or skip the collecting: the Hockey & Cross-League Projects bundle has this whole course’s scripts and data in one ZIP.