Pull Live Soccer Results from ESPN's Public Scoreboard API
Part 7 of 7 in Working with Real Sports APIs · course bundle (code + data)
What you'll build
The complete 2025-26 Premier League pulled live from ESPN's keyless scoreboard JSON - all 380 matches in one date-range call after dodging the endpoint's silent 100-event cap - flattened to a tidy CSV behind a guard that refuses to overwrite a complete season with a worse refresh, plus the season read: goals per match, the home/draw/away split, and the month-by-month scoring shape.
ESPN never advertises an API, but every scoreboard page on the site is fed by one — a keyless JSON endpoint under site.api.espn.com that hands you real Premier League results for a single GET. No token, no signup, no wrapper library to install. This tutorial opens it the way you’d open any undocumented API in production: probe one day’s scoreboard to learn the shape (last Saturday’s included Hull City 2-0 Manchester United, which is why we check data instead of assuming it), then pull the complete 2025-26 season — all 380 matches in one date-range call. The endpoint fights back twice, and both fights are the curriculum: it silently caps any response at 100 events unless you raise the limit, and it returns 403 to requests dressed up as a browser while happily serving an honest default python-requests User-Agent — the exact opposite of what the NBA’s API demands. Both behaviors are measured, not rumored; you’ll reproduce them yourself in steps 1 and 2.
You want two things on board before starting: the endpoint-and-parameters vocabulary from how to read API documentation and the groupby fluency from the aggregation tutorial. The NHL pull is this tutorial’s sibling — the same raw-requests-and-JSON dance against a friendlier server. All live outputs below were retrieved August 25, 2026; everything after the pull also runs offline from the bundled epl_results_2025_26.csv the script saves — which is exactly the file the guard in step 4 exists to protect.
-
Probe one day’s scoreboard
Never start an undocumented API with your real query. Start with the smallest request that can succeed, and read what comes back. The scoreboard endpoint takes a
dates=parameter asYYYYMMDD; the league lives in the URL path (eng.1is the Premier League). One deliberate choice here: no fake headers. On most sports APIs you’d send a browser User-Agent — stats.nba.com won’t talk to you without one. ESPN’s edge does the reverse: from this machine, the spoofed Chrome User-Agent gets403 Forbiddenand the honest default one gets200. Bot filters look for costumes. Identify yourself plainly, and save the disguises for servers that require them.python import requests BASE = "https://site.api.espn.com/apis/site/v2/sports/soccer/eng.1/scoreboard" day = requests.get(BASE, params={"dates": "20260822"}, timeout=30) day.raise_for_status() day = day.json() lg = day["leagues"][0] print(f'{lg["name"]} - {lg["season"]["displayName"]}') print(f'scoreboard for dates=20260822: {len(day["events"])} events\n') for ev in day["events"]: sides = {c["homeAway"]: c for c in ev["competitions"][0]["competitors"]} print(f' {ev["date"]} {sides["home"]["team"]["displayName"]:<24} ' f'{sides["home"]["score"]}-{sides["away"]["score"]} ' f'{sides["away"]["team"]["displayName"]:<24} ' f'({ev["status"]["type"]["detail"]})')One Saturday of the current season, straight from the JSONEnglish Premier League - 2026-27 English Premier League scoreboard for dates=20260822: 5 events 2026-08-22T11:30Z Hull City 2-0 Manchester United (FT) 2026-08-22T14:00Z Everton 2-0 Crystal Palace (FT) 2026-08-22T14:00Z Ipswich Town 2-1 Sunderland (FT) 2026-08-22T14:00Z Nottingham Forest 0-1 Leeds United (FT) 2026-08-22T16:30Z Brentford 3-0 Tottenham Hotspur (FT)
Real matches, real scores, five events on a quiet Saturday of the young 2026-27 season. The one-line dictionary trick in the loop is worth keeping: each event carries a
competitorslist whose order you shouldn’t trust, but every competitor declares itself"home"or"away"— so{c["homeAway"]: c for c in ...}turns the list into a dictionary you can index by role. And note whatraise_for_status()buys you: if ESPN ever does refuse the request, the script stops loudly on that line instead of handing mysteriousKeyErrors to the code below it. -
Pull the whole season — and meet the silent cap
The
dates=parameter also accepts a range,YYYYMMDD-YYYYMMDD. So the obvious move is one call spanning August 2025 to June 2026, and the obvious move is a trap. Run it both ways and count:python short = requests.get(BASE, params={"dates": "20250801-20260601"}, timeout=60).json() print(f'dates=20250801-20260601 -> {len(short["events"])} events (!)') full = requests.get(BASE, params={"dates": "20250801-20260601", "limit": 500}, timeout=60).json() print(f'dates=20250801-20260601&limit=500 -> {len(full["events"])} events')The same request, with and without limit=dates=20250801-20260601 -> 100 events (!) dates=20250801-20260601&limit=500 -> 380 events Same range, same HTTP 200. Without limit= the endpoint quietly returns its default page of 100 - no error, no warning field. A 380-match season pulled naively is a 100-match season.
This is the most instructive failure mode in data engineering: the one that looks like success. HTTP 200, valid JSON, a plausible list of matches — and 280 of them missing, because the endpoint’s default page size is 100 and nothing in the response says “truncated.” If you hadn’t known a Premier League season has 380 matches, when would you have noticed? That’s the discipline this step teaches: every pull ends by comparing the count you got against the count the world says you should have. A season has 20 teams playing 38 games; those numbers are checkable, and step 3 checks them. One etiquette note before moving on: this tutorial makes three requests total, a second apart, and then never touches the network again — the season is done, the file is saved, and re-running your analysis fifty times re-reads a local CSV instead of re-asking ESPN.
-
Flatten the JSON into one row per match
Each event nests what we want three layers deep: the kickoff time on the event, the teams and scores inside
competitions[0].competitors, the venue and attendance beside them. Wrap the unpacking in a function — not for elegance, but because step 4 is about to feed it two different pulls, and a transformation you’ll apply twice belongs in one place. Two details deserve their honesty flags: scores arrive as strings ("4", not4— JSON APIs do this constantly, and pandas will happily sort strings into"10" < "2"nonsense if you skip theint()), and we keep only events whose status sayscompleted, so a postponed fixture can never sneak a 0-0 into the dataset.python import pandas as pd def tidy(events): """Flatten ESPN scoreboard events into one row per completed match.""" rows = [] for ev in events: if not ev["status"]["type"]["completed"]: continue comp = ev["competitions"][0] sides = {c["homeAway"]: c for c in comp["competitors"]} rows.append({ "date": ev["date"][:10], "home": sides["home"]["team"]["displayName"], "away": sides["away"]["team"]["displayName"], "home_goals": int(sides["home"]["score"]), "away_goals": int(sides["away"]["score"]), "venue": comp.get("venue", {}).get("fullName", ""), "attendance": int(comp.get("attendance") or 0), }) return pd.DataFrame(rows).sort_values(["date", "home"]).reset_index(drop=True) df = tidy(full["events"]) print(len(df), df["home"].nunique(), df["date"].min(), df["date"].max()) print(sorted({ev["season"]["slug"] for ev in full["events"]})) df.head()The season, validated and tidy380 completed matches from live pull teams: 20 dates: 2025-08-15 to 2026-05-24 season tag on every event: ['2025-26-english-premier-league'] date home away home_goals away_goals venue attendance 0 2025-08-15 Liverpool AFC Bournemouth 4 2 Anfield 60315 1 2025-08-16 Aston Villa Newcastle United 0 0 Villa Park 42526 2 2025-08-16 Brighton & Hove Albion Fulham 1 1 American Express Stadium 31478 3 2025-08-16 Sunderland West Ham United 3 0 Stadium of Light 46233 4 2025-08-16 Tottenham Hotspur Burnley 3 0 Tottenham Hotspur Stadium 61077The validation trio does its job: 380 matches, 20 teams, 2025-08-15 to 2026-05-24 — opening day to final day, nothing missing, nothing extra. The last check is the subtle one: every event carries a season tag, and printing the set of tags proves the date range didn’t smuggle in matches from a neighboring season (the range ends June 1, and had a 2026-27 friendly lived there, this line would have caught it). Note the fields we didn’t hard-index:
venueandattendanceride through.get()with defaults, because optional extras should degrade to blanks, not crash the pull. -
The guard: never overwrite good data with a bad refresh
Here is where a script becomes a dataset you maintain. The naive save is one line,
df.to_csv(...)— and it means the next run, months from now, on hotel wifi, with a half-failed pull or a forgottenlimit=, silently replaces your complete season with a stump. The fix is a promotion rule: validate the new pull against the file already on disk, and refuse the write if it’s worse. Row count is the crudest possible fitness test and still catches the two real failure modes this API has shown us. Best of all, we don’t have to invent a bad refresh to prove the guard works — step 2’s capped pull is one:python import os def promote(new_df, path): """Write new_df to path only if it is at least as complete as the file there.""" have = len(pd.read_csv(path)) if os.path.exists(path) else 0 if len(new_df) < have: print(f"REFUSED: fresh pull has {len(new_df)} rows; " f"{os.path.basename(path)} already holds {have}. Keeping the file.") return False new_df.to_csv(path, index=False) print(f"promoted: {len(new_df)} rows -> {os.path.basename(path)} (replaced {have})") return True promote(tidy(full["events"]), "epl_results_2025_26.csv") # the real season promote(tidy(short["events"]), "epl_results_2025_26.csv") # the capped pull from step 2The guard, tested against the failure the API actually producespromoted: 380 rows -> epl_results_2025_26.csv (replaced 0) REFUSED: fresh pull has 100 rows; epl_results_2025_26.csv already holds 380. Keeping the file.
First call promotes 380 rows into an empty slot; second call — fed the genuinely truncated 100-event response — is refused, and the good file survives. This validate-before-write shape is the smallest member of a family you’ll meet everywhere serious data lives: production pipelines stage a fresh table, run checks against the live one, and swap only on a pass. Ours fits in twelve lines because the check is one comparison, but the skeleton is the same, and it grows naturally — add “20 unique teams,” add “no null scores,” add a dated backup before the swap if you want an undo trail. The principle doesn’t change: the burden of proof is on the new data.
-
The season read: 2.75 goals a match, and the home edge intact
The payoff for clean plumbing is that analysis becomes short. Label each match’s result, count the three outcomes, and group goals by month:
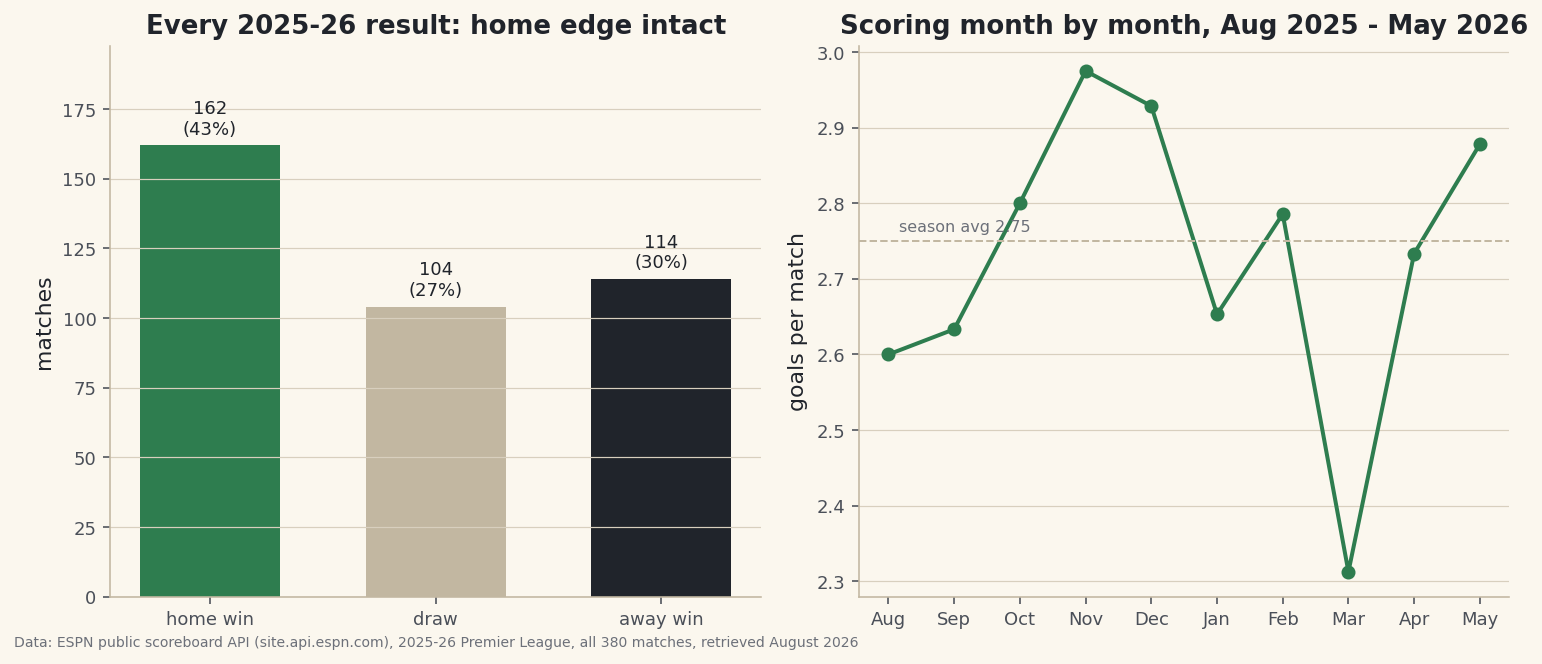
python df["total"] = df["home_goals"] + df["away_goals"] df["result"] = "draw" df.loc[df["home_goals"] > df["away_goals"], "result"] = "home win" df.loc[df["home_goals"] < df["away_goals"], "result"] = "away win" n = len(df) print(f"goals: {df['total'].sum()} total, {df['total'].mean():.2f} per match") split = df["result"].value_counts().reindex(["home win", "draw", "away win"]) for r, c in split.items(): print(f" {r:<9} {c:>3} ({100 * c / n:.1f}%)") big = df.loc[df["total"].idxmax()] print(f"highest-scoring match: {big.home} {big.home_goals}-{big.away_goals} " f"{big.away} ({big.date})") by_month = (df.assign(month=pd.to_datetime(df["date"]).dt.to_period("M")) .groupby("month")["total"].mean()) print(f"scoring by month: {by_month.min():.2f} per match in {by_month.idxmin()} " f"to {by_month.max():.2f} in {by_month.idxmax()}")What 380 matches say, three groupbys later2025-26 Premier League, all 380 matches: goals: 1045 total, 2.75 per match home win 162 (42.6%) draw 104 (27.4%) away win 114 (30.0%) highest-scoring match: Fulham 4-5 Manchester City (2025-12-02) biggest crowd: 74,257 - Manchester United v Burnley at Old Trafford (2025-08-30) scoring by month: 2.31 per match in 2026-03 to 2.98 in 2025-11
Three findings, all checkable against the file you just built. The league averaged 2.75 goals a match (1,045 in total). Home teams won 42.6% of matches against 30.0% for away sides — the venue edge that the home-advantage capstone measures across five leagues is alive and well in this one, worth about 48 extra home wins over the season. And scoring breathes with the calendar: a high of 2.98 per match in November 2025, a floor of 2.31 in March 2026, with the season closing at 2.88 in May as relegation fights and nothing-to-lose fixtures opened up. The season’s wildest single entry: Fulham 4-5 Manchester City on December 2 — nine goals, and the away side needed every one.
Data: ESPN public scoreboard API (live pull; bundled season CSV fallback), retrieved August 2026
What this dataset is, and what it isn’t
Be clear-eyed about what you now hold. It is a complete, validated results table for one league-season — every score, venue and attendance figure as ESPN serves them — and because the endpoint is keyless, everything here reruns for La Liga (esp.1), the Bundesliga (ger.1), or MLS (usa.1) by changing one path segment. It is not a contract: this API is undocumented, ESPN owes it to nobody, and endpoints like it get reshaped or retired without notice — which is an argument for the guard, the saved CSV, and gentle request habits, not against using it. It is also results-only. There are no shots, no expected goals, no events inside the ninety minutes; when the question needs that depth, StatsBomb’s free event data is the honest next door. And one modeling warning: 380 matches is a season, not a universe — the month-by-month wiggles in the chart include genuine schedule effects and plain noise, and deciding which is which is a job for the significance machinery, not the eyeball.
Troubleshooting
My request comes back 403 Forbidden
First suspect: you added a browser User-Agent out of habit, and this edge network treats impersonation as a bot signal — measured here, the spoofed Chrome header is exactly what earned the 403 while the default python-requests identity sailed through. Remove the costume. If you’re still blocked, slow down and wait: shared IPs (offices, VPNs, cloud notebooks) can carry a bad reputation score that has nothing to do with your code. What never helps is retrying in a tight loop — that’s how a temporary refusal becomes a durable one.
I asked for the season and got exactly 100 matches
That’s the default page size, and “exactly 100” is the tell — real seasons don’t land on round API numbers. Add limit=500 (anything comfortably above 380) and recount. The portable lesson: whenever a result count exactly equals a power-of-ten, suspect the API before you suspect the world. Ends-in-00 counts should trigger the same reflex a too-clean correlation does.
KeyError: 'venue' (or attendance is 0) on some matches
Optional fields are optional per event, not per API — lower divisions and cup fixtures omit venue objects routinely, and attendance can arrive as 0, missing, or null. That’s why tidy() reaches for them with comp.get("venue", {}).get("fullName", "") instead of square brackets: the essentials (teams, scores, status) fail loudly, the extras degrade to blanks. If you extend the parser to new fields, decide for each one which of those two behaviors it deserves before you write the line.
My dates look shifted by a day from the fixtures I remember
Event timestamps are UTC — that trailing Z in 2025-08-15T19:00Z is doing real work — and our ev["date"][:10] keeps the UTC calendar date. For English football that matches the local fixture date (evening kickoffs in summer are 19:00Z, not past midnight), but pull a league many time zones away — an MLS west-coast night match is early the next morning in UTC — and the naive slice starts mislabeling match days. The fix when it matters: parse the full timestamp with pd.to_datetime(..., utc=True) and convert with .dt.tz_convert() to the league’s zone before taking the date.
Challenge yourself
Three extensions, each one production habit deeper. First, breadth: rerun the pull for La Liga (esp.1) over the same window, and put both leagues’ goals-per-match and home-win rates side by side — one function argument should be all that changes, which is the test of whether your code is really a tool yet. Second, the daily delta: write a script that pulls only yesterday’s dates=, appends any completed matches to the CSV, and drops duplicates on (date, home, away) — run it every morning during the 2026-27 season and you own a live dataset that no single failed pull can ruin, because the guard idea now applies per-append. Third, the payoff loop: feed your finished CSV to the standings-table builder and check the top four against the real table, then hand the same file to the Poisson scoreline model — 380 matches of one league is exactly the data that model wanted and the World Cup couldn’t give it.
Get the code
Want it all in one file? This is the finished script behind this tutorial - the run that produced the outputs above.
Download the finished script (89_pull_live_soccer_results_from_espn.py)This script imports a small shared helper (and reads any bundled sample data) that live next to it in /downloads/ — grab these into the same folder so it runs as-is: sdt_common.py. Or skip the collecting: the Working with Real Sports APIs bundle has this whole course’s scripts and data in one ZIP.